COMPENSATION MANAGEMENT FOR BIOTECH & LIFE SCIENCES

CompBldr for Life Sciences: Radford-Anchored Compensation Governance

Life sciences compensation runs on Radford data, R&D job families, clinical operations grade structures, and OFCCP documentation. CompBldr is built for exactly this. See how.
What Makes Life Sciences Compensation Structurally Different

Clinical and non-clinical families need different survey sources

Clinical roles compete in the healthcare labor market; non-clinical roles like IT and Finance compete in the broad market. One survey source misprices one group. CompBldr blends MGMA and Mercer hospital data for clinical roles with Radford, Mercer MBD, and WTW at the job family level.

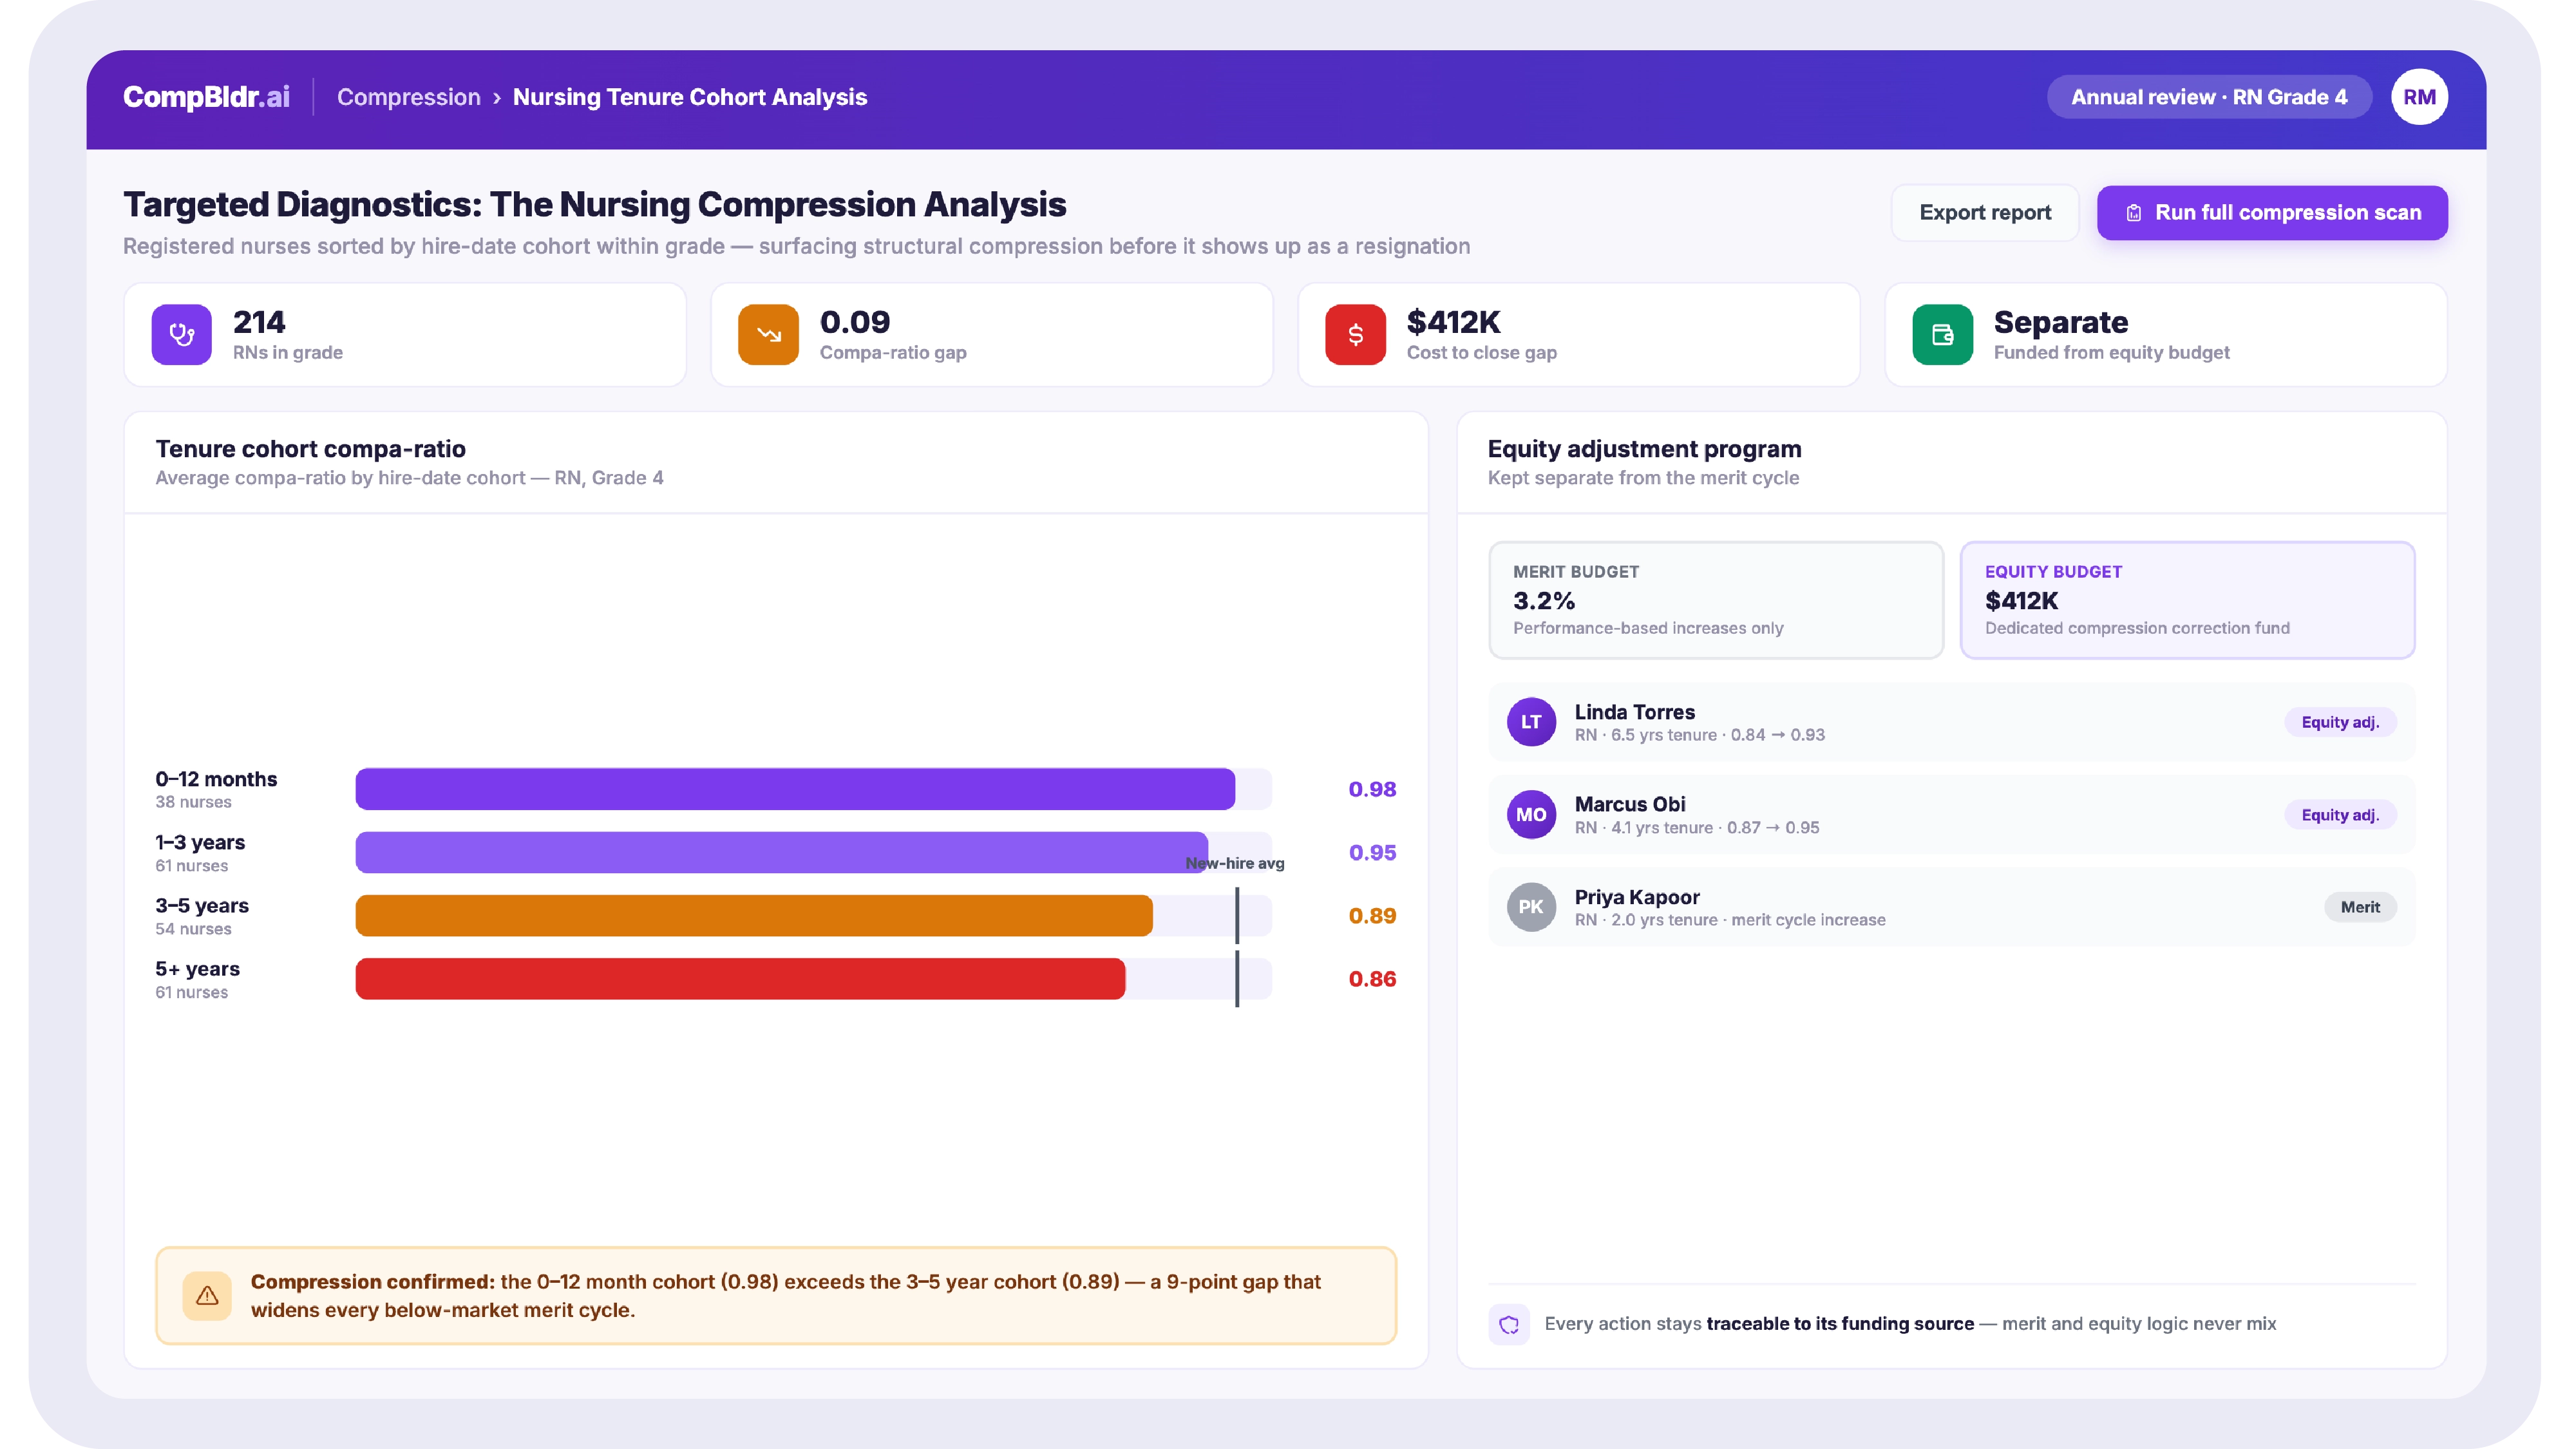
Nursing market volatility creates structural compression

An RN hired at $62,000 in 2019 earns about $74,000 today. The market rate for a new hire is $82,000 to $92,000. A 3.5 percent merit budget never closes that gap. CompBldr surfaces it through a tenure cohort compa-ratio analysis before it becomes an attrition crisis.

EEOC, OFCCP, and California CRD demand audit-ready data

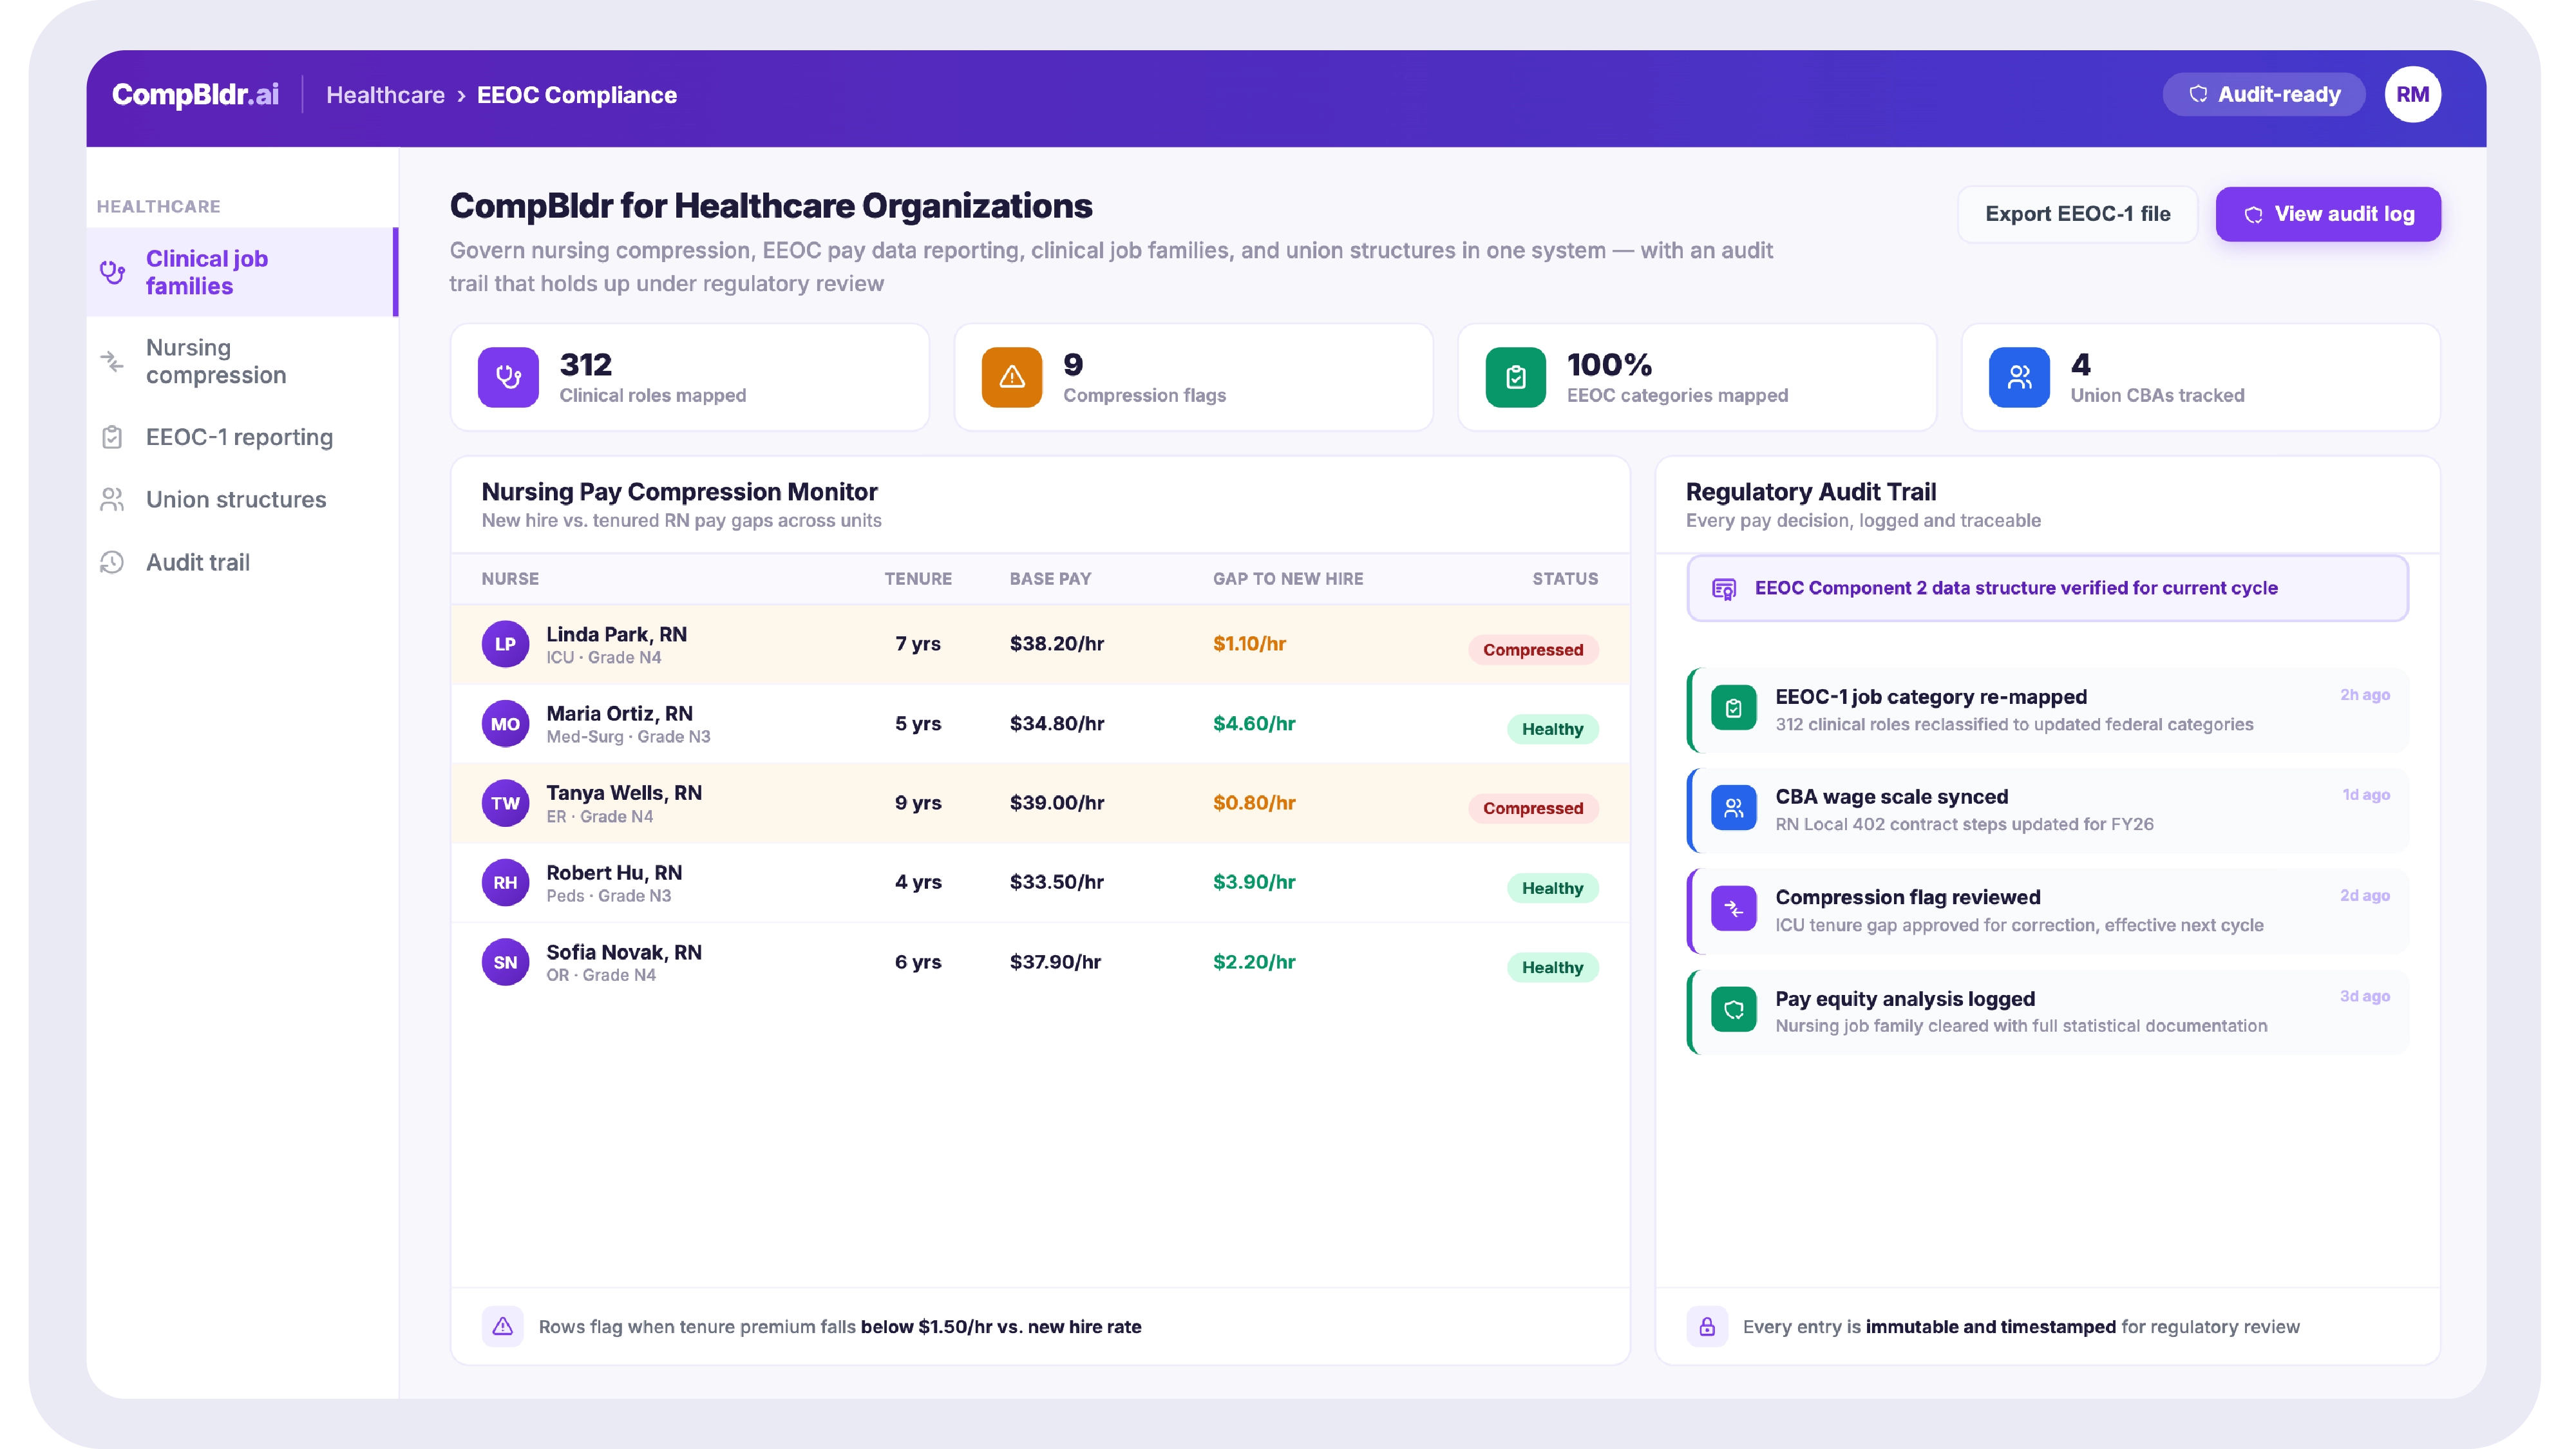
Employers with 100+ employees file EEOC Component 1. Federal contract holders (NIH, BARDA, Medicare in some interpretations) face OFCCP Affirmative Action obligations, including compensation analysis. California employers also file CRD pay data by the second Wednesday of May. All three need clean, consistent data by job category and demographics.

Union and non-union populations need separate governance

Union employees follow CBA pay scales and increase schedules. Non-union employees follow the merit matrix and salary band framework. CompBldr manages both in one platform, applying the right governance to each population and producing separate reporting for Finance, HR, and Labor Relations.

Four Compensation Analytics Dashboards,
Each Built for a Specific Decision

CompBldr Analytics is organized around the four decisions compensation teams make repeatedly. Each dashboard reads directly from the CompBldr module records. No manual data loading. No spreadsheet intermediary.

Pay Equity Dashboard

Cycle Data Arrives After the Cycle Closes

Continuously updated compa-ratio distribution across evaluated grades, job families, and workforce demographics. Includes pay range adherence rates, equity gap trend lines, and outlier flags. Every metric traces to an evaluation or pay action record. Exportable in board-ready format on demand.

Compa-ratio distribution by grade, job family, and demographic
Pay range adherence: percentage of population within, above, or below the benchmarked range
Equity gap trend over rolling 12 months
Statistical outlier flags for individuals and cohorts
One-page board-ready export

Budget Analytics Dashboard

For Finance, CHROs, and HR Operations

Connects compensation planning allocations to actual pay outcomes in real time. Finance and HR operate from the same numbers because both views read from the same governed planning record.

Budget allocation vs. current commitment, live during the cycle
Department-level spend from the total organization down to the individual cost center
Off-cycle adjustment impact on the approved budget
Forecast to close at the current approval rate
Historical cycle comparison using the same data structure

Market Position Dashboard

For Total Rewards and Finance

Connects benchmarked pay ranges from CompBldr's market benchmarking module to the current pay population. Shows where the organization is leading, matching, or lagging the market across each job family and geographic footprint.

Pay range position by job family vs. benchmarked 50th percentile
Lead, match, and lag strategy adherence by job family
Survey aging alerts for job families past the organization's refresh policy
Geographic pay differential by recruiting footprint
Range compression signals where the spread is narrowing relative to the market

Cycle Analytics Dashboard

For Compensation Analysts and HR Operations

Real-time visibility into the active compensation cycle from proposal submission through final approval. Available throughout the cycle, not only as a post-close report.

Cycle completion rate by manager and department
Merit distribution vs. merit matrix guideline, with deviation flags
A compression monitor for proposals that create or worsen pay compression
Budget consumption by approval stage
Approval queue status with cycle timeline tracking

EEOC and Pay Equity Compliance for Healthcare in 2026

Who must file and what they must report

Private healthcare employers with 100+ employees file EEOC Component 1 annually: employee counts by race, ethnicity, sex, and EEO-1 job category. California employers with 100+ California employees additionally file with the California Civil Rights Department by the second Wednesday of May, with mean and median hourly rates. The California report is more granular than the federal one.

OFCCP obligations for federal-contracted healthcare organizations

Organizations with 50+ employees and $50,000 or more in federal contracts must maintain annual Affirmative Action Programs that include compensation analysis, evaluating whether pay differences between demographic groups in comparable roles can be explained by legitimate factors. OFCCP examinations of healthcare organizations have increased in recent years.

How CompBldr prepares the data each filing requires

CompBldr maintains EEOC job category mapping and race, ethnicity, and sex data at the employee level. Component 1 filing data exports as standard. California CRD hourly rate calculations by job category and demographic intersection are produced as a report. For OFCCP, CompBldr produces the statistical output affirmative action consultants typically require.

What a Health System Gains From CompBldr in 90 Days

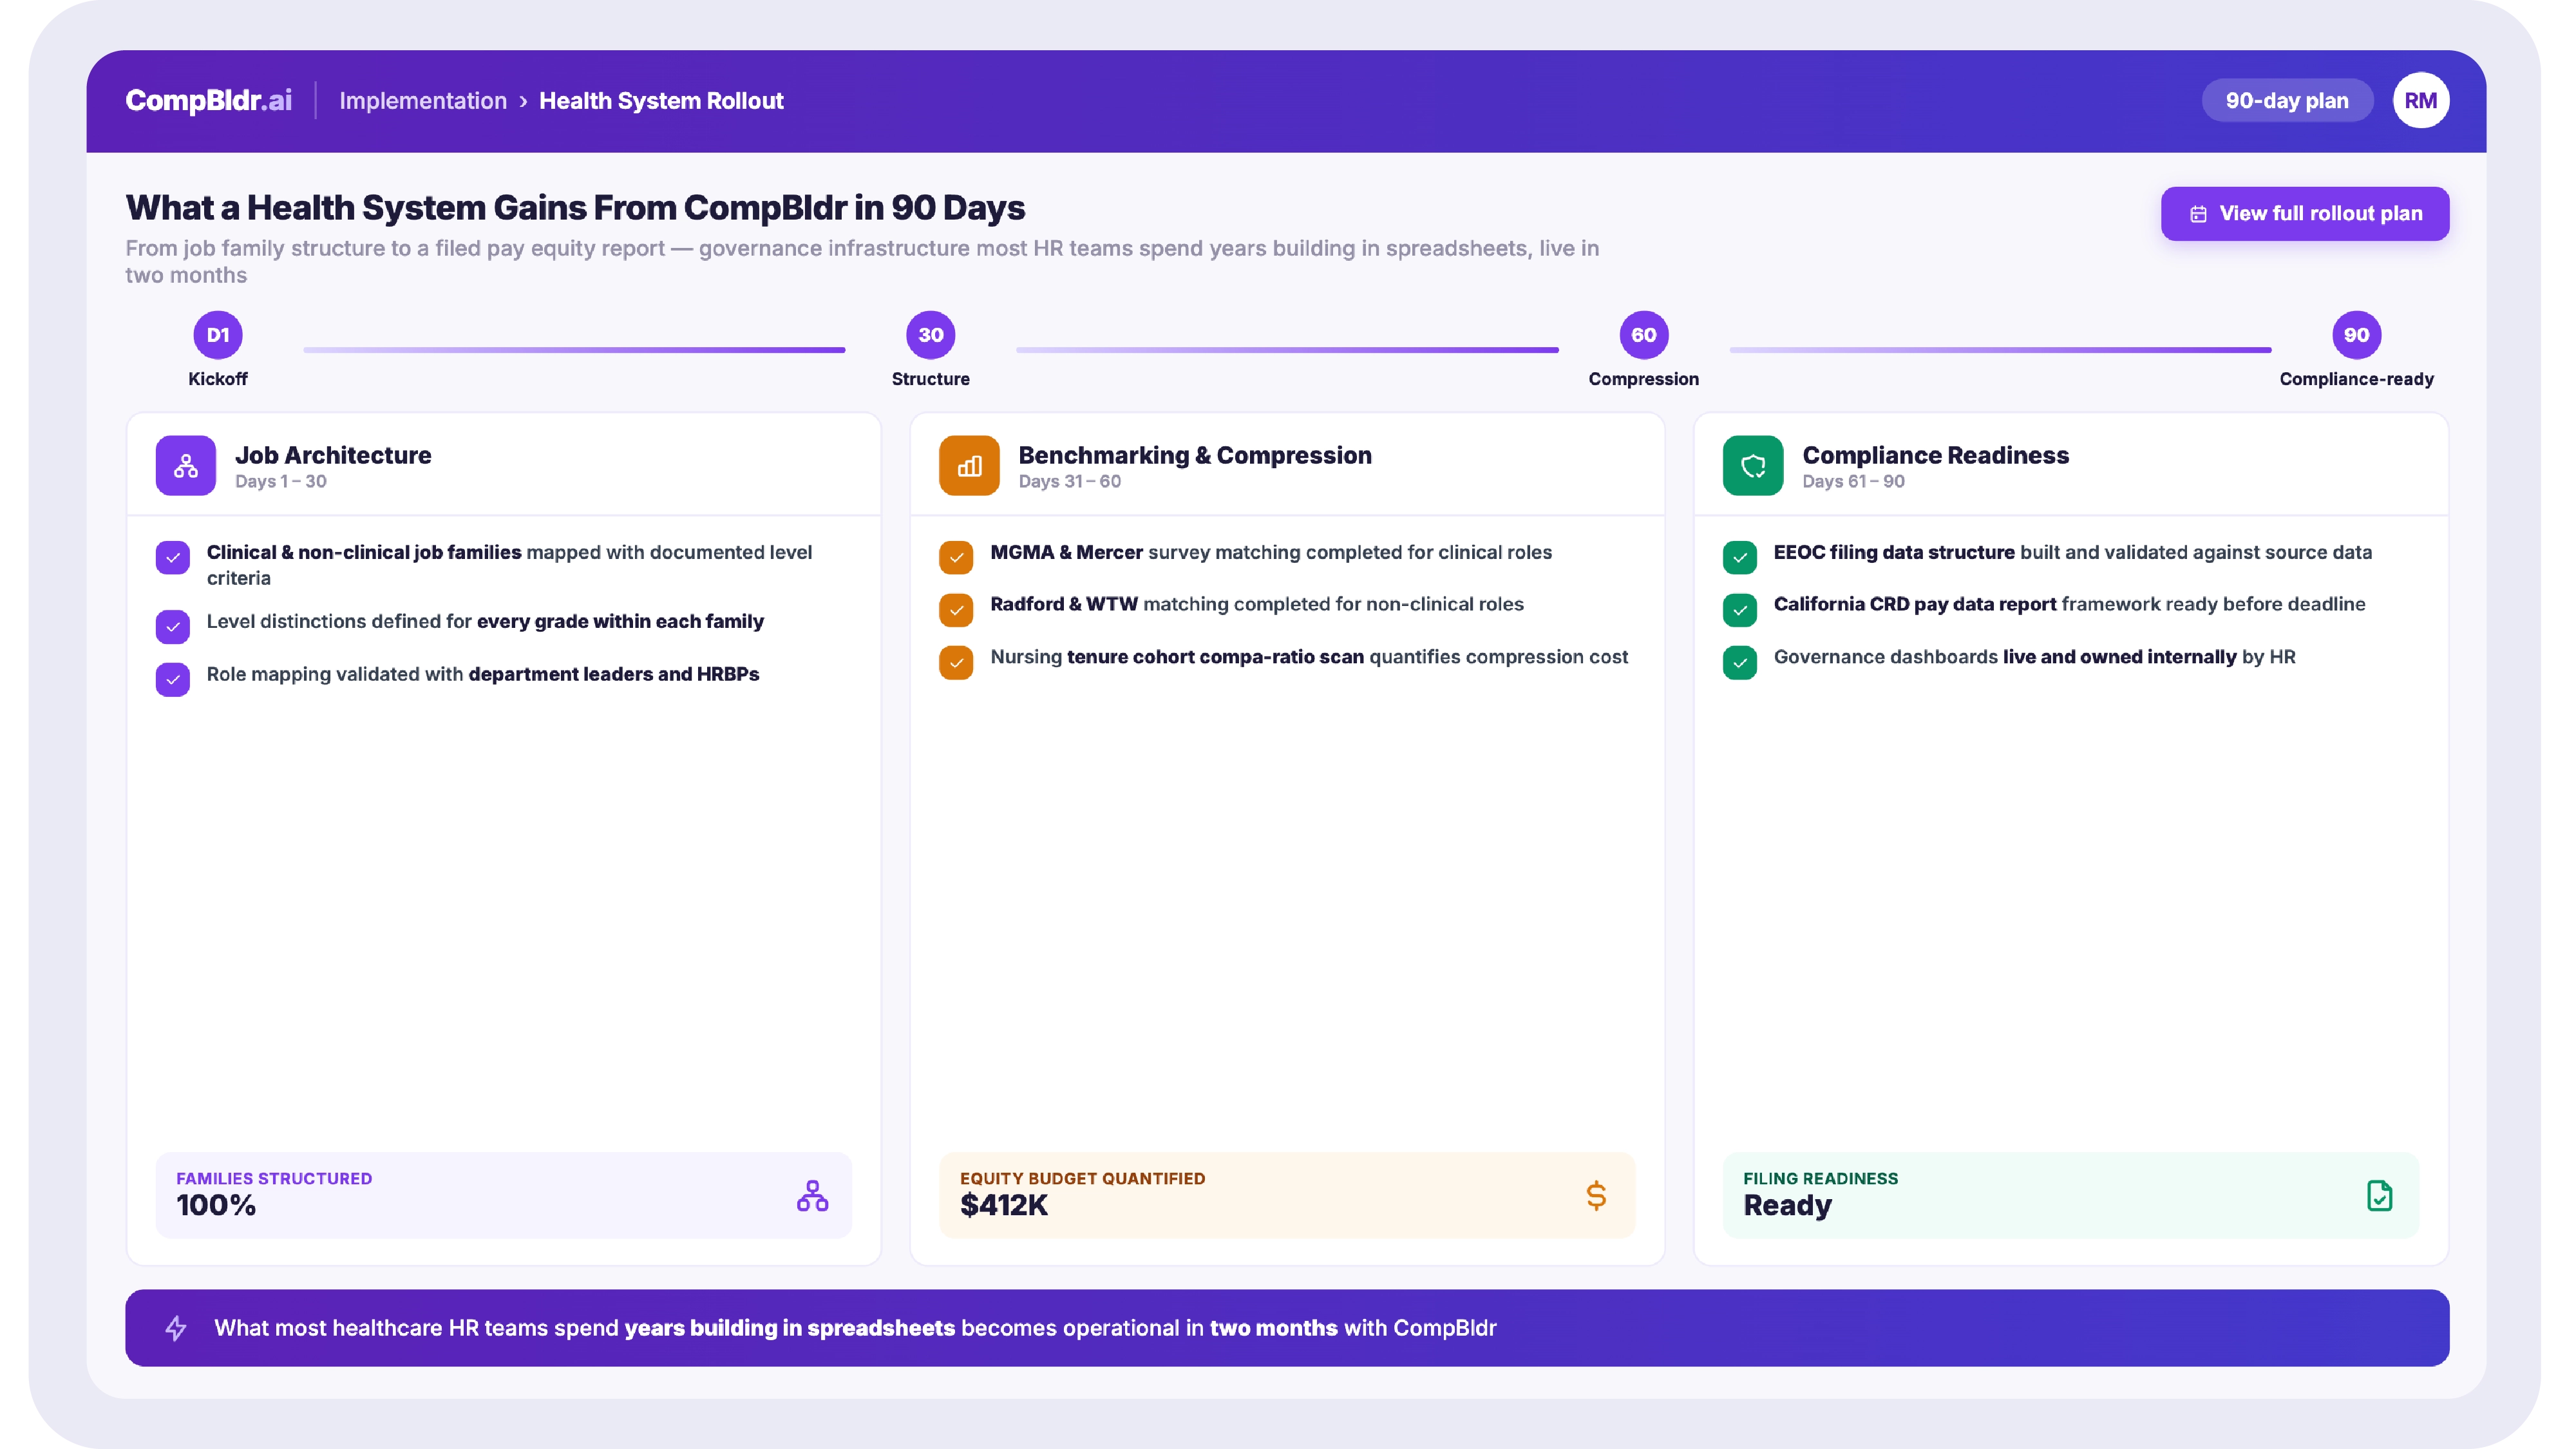
In 90 days, a health system establishes clinical and non-clinical job families with documented level criteria, completes MGMA and Mercer survey matching for clinical roles and Radford/WTW for non-clinical roles, runs the nursing compression cohort analysis and quantifies the equity budget needed, and produces the EEOC and California CRD filing frameworks before the next deadline. The governance infrastructure most HR teams try to build in spreadsheets is operational within two months.
Milestone sequence
01
Job families
02
Survey matching
03
Compression analysis
04
EEOC and CRD data structure

Explore the CompBldr Platform

Your JDs Are Scattered Across 3 Shared Drives. That Ends Today.
JobBldr replaces unstructured docs and email approvals with a governed platform every edit logged, every review routed, every role connected to your comp architecture.
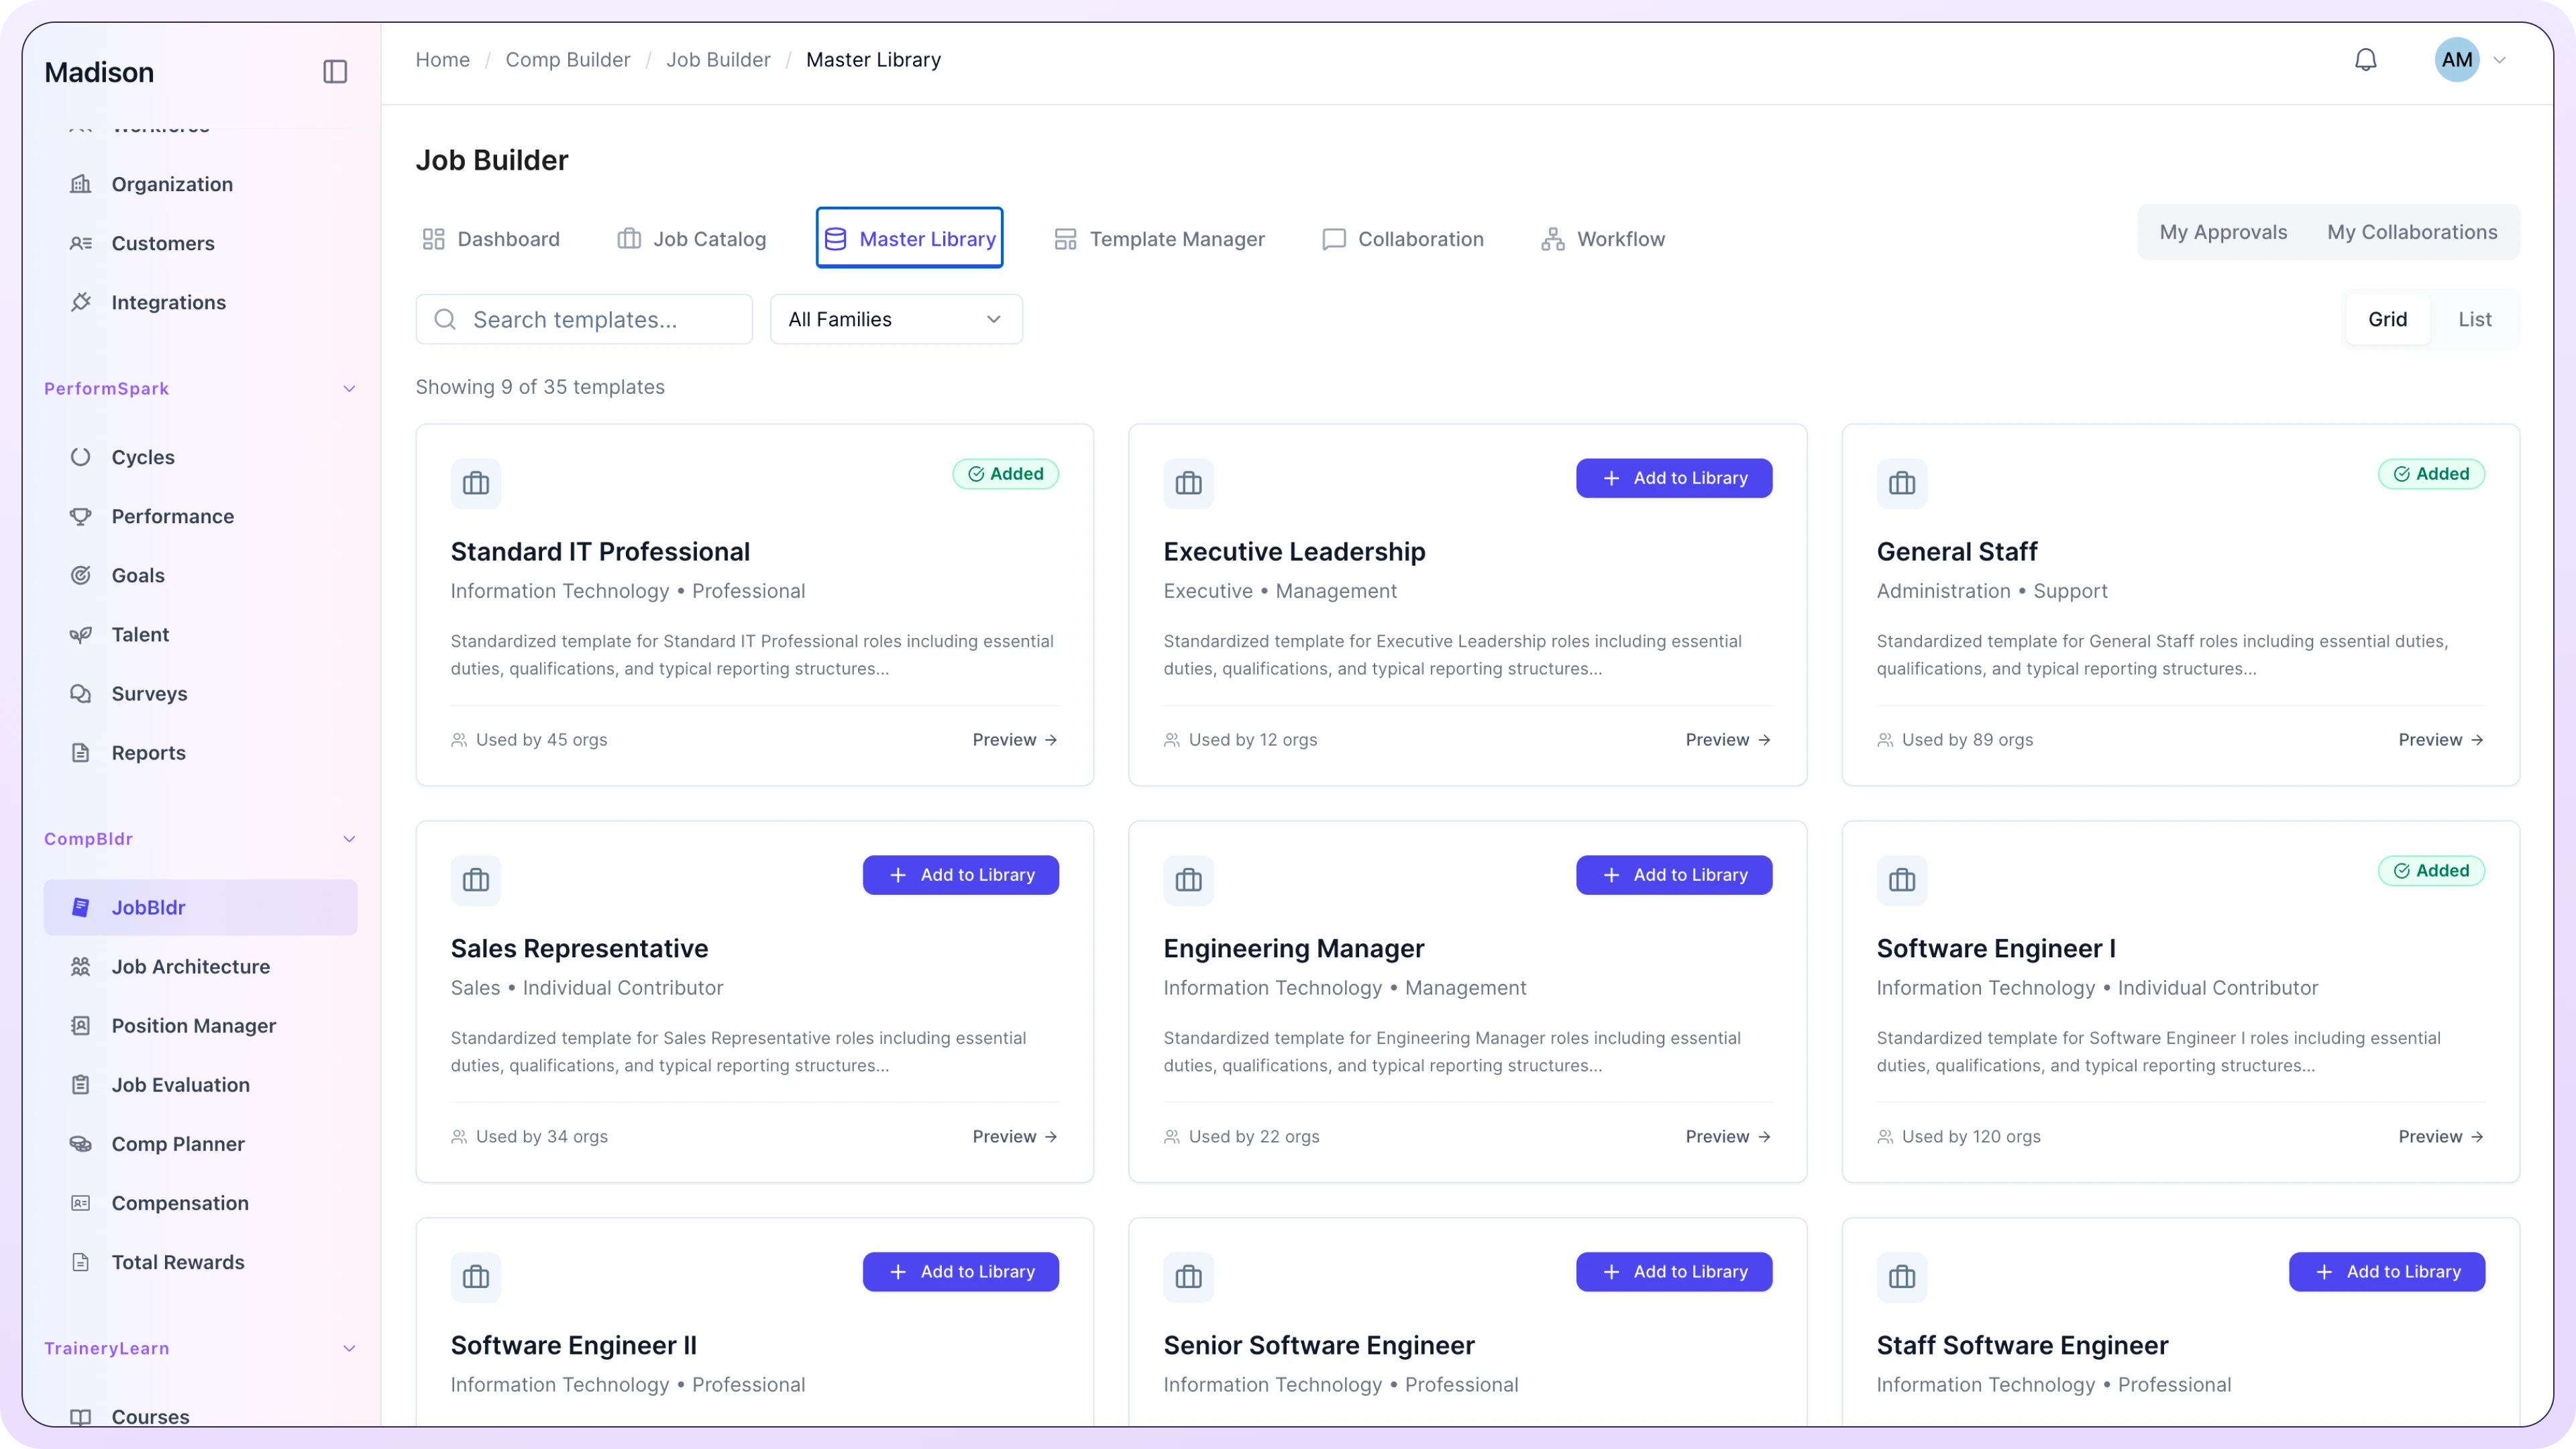
Governed master library searchable by title, code, family, or group
Multi-level approval routing: Legal, HR Director, VP, Comp Committee
Every save versioned color-coded diffs show what changed and when
External reviewers get scoped access, no emailed Word docs, no version conflicts
Explore JobBldr
73% of Orgs Have Inconsistent Titles. Build One Structure Everyone Uses.
Job Architecture defines families, grades, codes, and levels giving every role a governed structural address before anything else happens. The foundation every other module builds on.
Job families, sub-families, and groups, one taxonomy across every entity
Score-based grade placement from JESAP evaluation not manager judgment
Structured job codes (ENG-FSD-G1-001) that travel across every module
Grade Title Matrix surfaces gaps immediately not during an audit
Explore Job Architecture
61% of Evaluations Lack Consistency. Score Every Factor. Defend Every Grade.
The JESAP® 15-factor methodology scores every role objectively with full version history, AI calibration, and grade structures that hold up under any audit or board review.
15 compensable factors across knowledge, complexity, accountability, and conditions
Quick Evaluation mode score a full role in minutes without switching screens
Every version saved: evaluator, scores, grade result, and timestamp all permanent
AI calibration flags where scores diverge, surfaces bias before it compounds
Explore Job Evaluation
You Spend Six Figures on Survey Data. Then Waste 40 Hours Matching It Manually.
Radford, Mercer, and WTW data maps directly to your architecture, automatically. No spreadsheets, no subjective matching, no analyst weeks rebuilding the same work every cycle.
AI matching uses architecture context family, grade, scope not just title keywords
Up to six data sources blended with configurable weighting by job family
Confidence scores flag positions where percentiles may be unreliable
Approved matches carry forward only new roles need remapping each cycle
Explore Market Benchmarking
Your Last Merit Cycle Blew the Budget by 17%. This One Won't.
One governed system for merit increases, bonuses, and incentives with real-time budget tracking, performance linkage, and structured approvals that catch overruns before they happen.
Budget consumption updates live as managers submit, Finance sees the same number
Merit ranges apply automatically by rating band and grade level
Every proposal, approval, and override logged: reviewer, timestamp, rationale
Compression flagged before it becomes a pay equity problem
Explore Compensation Planning
2,800 Personalized Statements in 4 Days. Last Year It Took 3 Weeks.
A five-step governed workflow template, builder, data import, cycle management, and approval replaces the spreadsheets and vendor PDFs that make statement production a recurring nightmare.
9 professional templates with live preview pick the right design for each population
Drag-and-drop builder, 8 block types live preview updates instantly
AI data mapping auto-detects column headers even non-standard naming
Every statement reviewed in rendered preview before distribution, HR controls release
Explore Total Rewards

Frequently Asked Questions

What is nursing pay compression and how do you fix it?

Nursing pay compression occurs when tenured nurses are paid at nearly the same level as new hires, caused by market rates outpacing merit budgets. It is identified through tenure cohort compa-ratio analysis and fixed through a separately funded equity adjustment program, not the merit cycle.

What surveys cover nursing and allied health benchmarking?

MGMA covers physicians and advanced practice providers, Mercer's hospital survey covers nursing and allied health, and Sullivan Cotter covers the broader clinical workforce. For non-clinical roles, Radford, Mercer MBD, and WTW apply. CompBldr supports all with configurable blend weights by job family.

What EEOC obligations apply to healthcare employers in 2026?

Employers with 100+ employees file EEOC Component 1 annually. Organizations with 50+ employees and $50,000+ in federal contracts face OFCCP Affirmative Action requirements. California employers with 100+ California employees also file the CRD pay data report by the second Wednesday of May.

How does CompBldr handle union vs non-union employees in the same system?

Union employees are governed by CBA pay scales entered into CompBldr; non-union employees follow the merit matrix and salary bands. Both appear in consolidated HR and Finance reporting while governance workflows stay separate, meeting Labor Relations documentation requirements.

Does CompBldr support geographic pay differentials for multi-site health systems?

Yes. Health systems operating across multiple markets can configure separate location-specific salary bands, for example San Francisco, Sacramento, and rural Northern California, each reflecting local labor market conditions and documented in the salary band methodology.

What is the California CRD pay data report and who must file it?

An annual filing required from private employers with 100+ California employees, due the second Wednesday of May. It requires mean and median hourly rates by EEO-1 category, race, ethnicity, and sex, per California establishment, and is more granular than the federal EEOC filing.

Book a Healthcare-Specific CompBldr Demo

Nursing compression analysis, EEOC pay data prep, and clinical benchmarking in one platform. See it in 15 minutes.