

.svg)





.webp)

The average U.S. base-pay increase actually given in 2026 was 3.4%, according to Payscale's 2026–2027 Salary Budget Survey. That figure is more useful now than the early 2026 forecasts because it reflects increases employers reported giving, not only what they planned months earlier. Mercer also reported that actual 2026 salary budgets finished slightly below its original projections, reinforcing the same pattern: salary growth remained moderate rather than accelerating.
The important distinction is that base-pay increases, merit increases, and total salary increase budgets are not interchangeable metrics. Payscale reports 3.4% as the average and median U.S. actual base-pay increase for 2026. Mercer had projected 3.2% for merit and 3.5% for total salary increases, then reported actual 2026 budgets 0.1 percentage point lower. Compensation teams should keep those definitions separate when benchmarking a compensation planning cycle.
Sources: Payscale 2026–2027 Salary Budget Survey and Mercer 2027 compensation planning update.
What Is the Average Salary Increase in 2026?
For a current U.S. benchmark, use 3.4% as the average actual base-pay increase reported for 2026 in Payscale's survey. The same survey reports a 3.4% median, which means the central result and the overall average are closely aligned in that dataset.
Do not automatically convert 3.4% into a companywide merit increase. A salary increase dataset can include different pay actions and employee populations depending on the survey methodology. Your own cycle still needs to distinguish merit, promotions, market adjustments, equity corrections, and other changes to base salary.
2026 U.S. Salary Increase Data by Industry
Payscale's current survey provides actual 2026 base-pay increase averages by industry. These are useful external reference points, but the sample sizes and workforce mix differ by industry, so they should not be treated as prescribed budgets.
| Industry | 2026 actual average base-pay increase |
|---|---|
| Aerospace & Defense | 5.1% |
| Legal Services | 4.4% |
| Media, Sports & Entertainment | 4.0% |
| Business Services | 3.9% |
| Distribution, Logistics & Transportation | 3.9% |
| Pharmaceutical & Biotechnology | 3.9% |
| Construction | 3.8% |
| Technology | 3.6% |
| Financial Services | 3.4% |
| Manufacturing | 3.4% |
| Healthcare & Social Assistance | 3.0% |
| Government | 3.0% |
| Nonprofit | 2.8% |
| Telecommunications | 2.5% |
Two cautions matter when using this table. First, industry averages can be influenced by sample composition. Second, an industry average does not tell you whether a specific job family is below market, compressed against another level, or already high in its salary range.
Why 3.4% Should Not Become a Flat Merit Rule
A market average is an external reference point, not an employee-level formula. Applying the same 3.4% to every employee preserves the relative distance between employees unless another adjustment changes the relationship.
Illustrative example: Employee A is at a 0.88 compa-ratio and Employee B is at 1.05. If both receive the same percentage increase and the salary range does not change, the gap in their relative range position remains broadly intact. That may be acceptable under your policy, or it may conflict with the objective of moving selected employees toward a different pay position.
This is why a team should review the average alongside compa-ratio and range penetration, performance inputs where used, critical-skill needs, internal equity, pay compression, and market evidence.
How to Turn the External Benchmark Into a Salary Budget
Start with the external benchmark, then model the actual workforce. A practical compensation-team sequence is:
- Separate the pay actions. Estimate merit, promotion, market adjustments, equity corrections, and any other planned increases separately.
- Review current pay position. Examine compa-ratio, range penetration, compression, and employees outside the intended salary-range position.
- Model eligibility and guidelines. If the organization uses a merit matrix, test how the configured guidelines distribute spend instead of assuming one flat percentage.
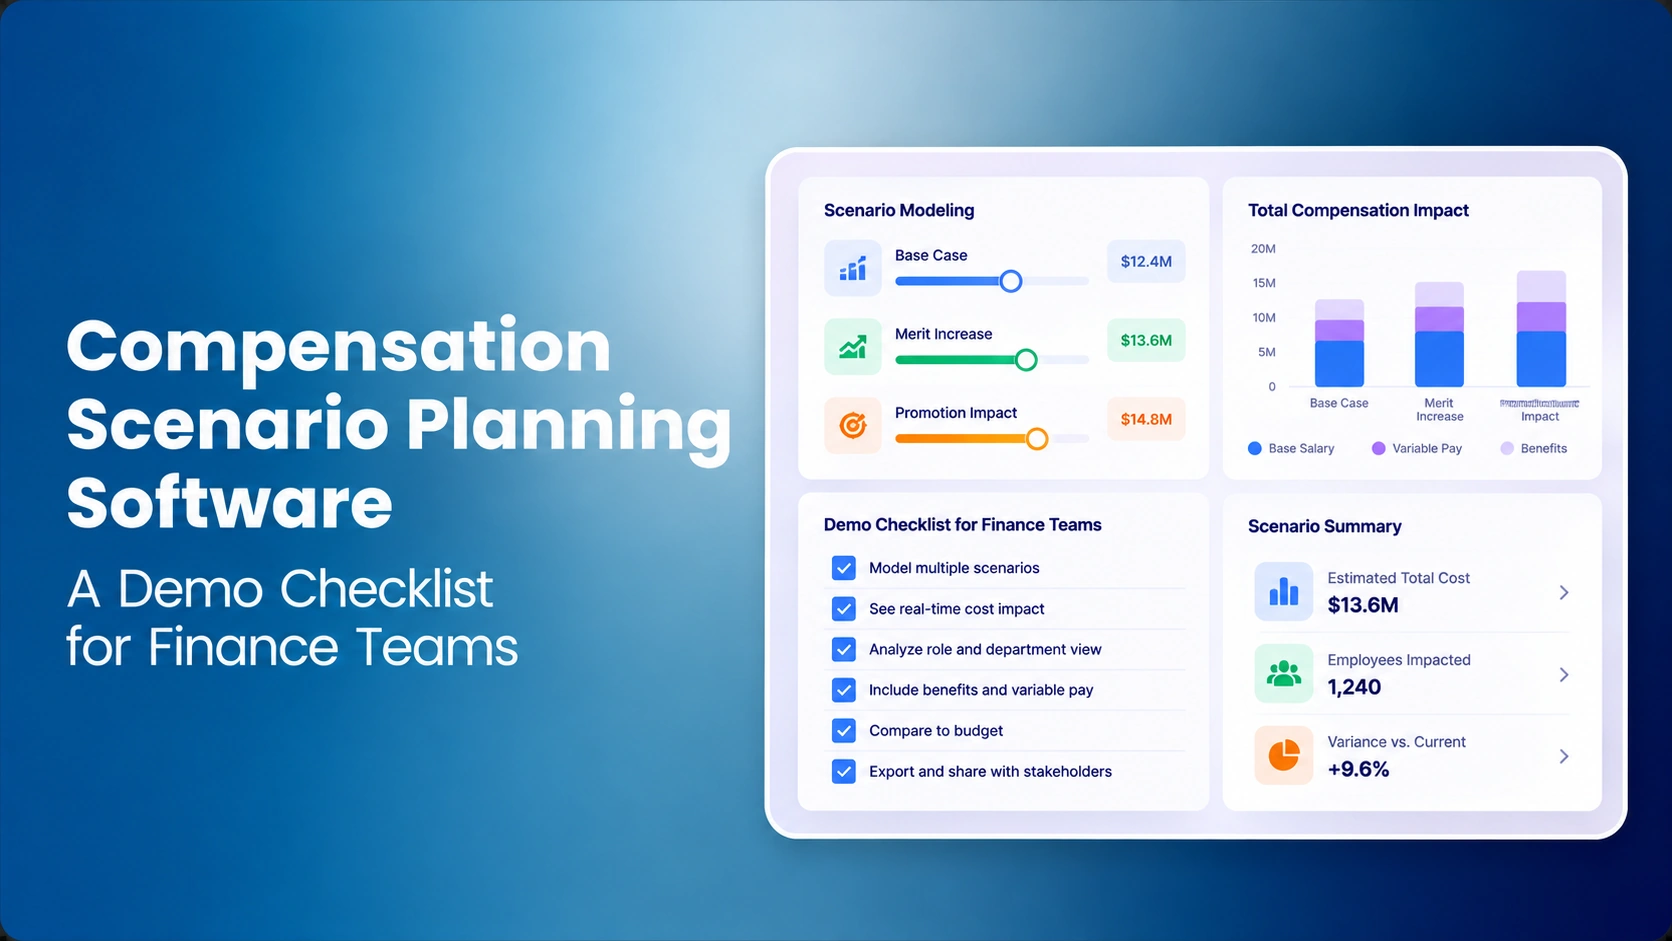
- Run scenarios against the budget. Compare a baseline scenario with targeted alternatives before managers submit proposals.
- Keep exceptions reviewable. Preserve the reason, approver, and budget impact for out-of-guideline decisions during the merit cycle.
The objective is not to “beat” the national average. It is to understand what the average says about the external market and then decide how much spend your own workforce structure and policy require.
What to Show a CFO or Compensation Committee
A useful budget request separates evidence from assumptions. Show the external market benchmark, the organization's salary-range position, the number and cost of employees affected by compression or market gaps, the proposed distribution logic, and the budget impact by pay-action type.
Avoid presenting a generic turnover-cost estimate as proof that every additional merit dollar produces a predictable return. Instead, connect the proposal to observable compensation risks and model the alternatives. Use compensation analytics and compensation reporting to compare scenarios and explain where the spend is going.
What the 2026 Data Says About 2027 Planning
Payscale's latest survey shows U.S. employers planning an average 3.5% base-pay increase for 2027, up slightly from the 3.4% they reported giving in 2026. Mercer is also projecting 3.2% average merit increases and 3.5% total salary increases for 2027. The direction is stable rather than dramatic.
That makes the 2026 actual data a useful baseline for next year's planning, but not a substitute for current market benchmarking, updated salary ranges, and workforce-specific modeling.
Use the 2026 Average as Context, Not the Answer
The most defensible answer to “What is the average salary increase in 2026?” is 3.4% for actual U.S. base-pay increases in Payscale's current dataset. The more important compensation question is what your organization should do with that benchmark.
Before finalizing the cycle, review salary ranges, pay position, compression, market adjustments, and pay equity signals together. Then preserve the assumptions and approved decisions in one planning record so Finance, HR, and managers are working from the same logic.
CompBldr connects market benchmarking, salary structures, pay-position context, planning workflows, analytics, and reporting. Book a Demo to test the workflow against your own compensation cycle.


.svg)

.svg)
.svg)

