

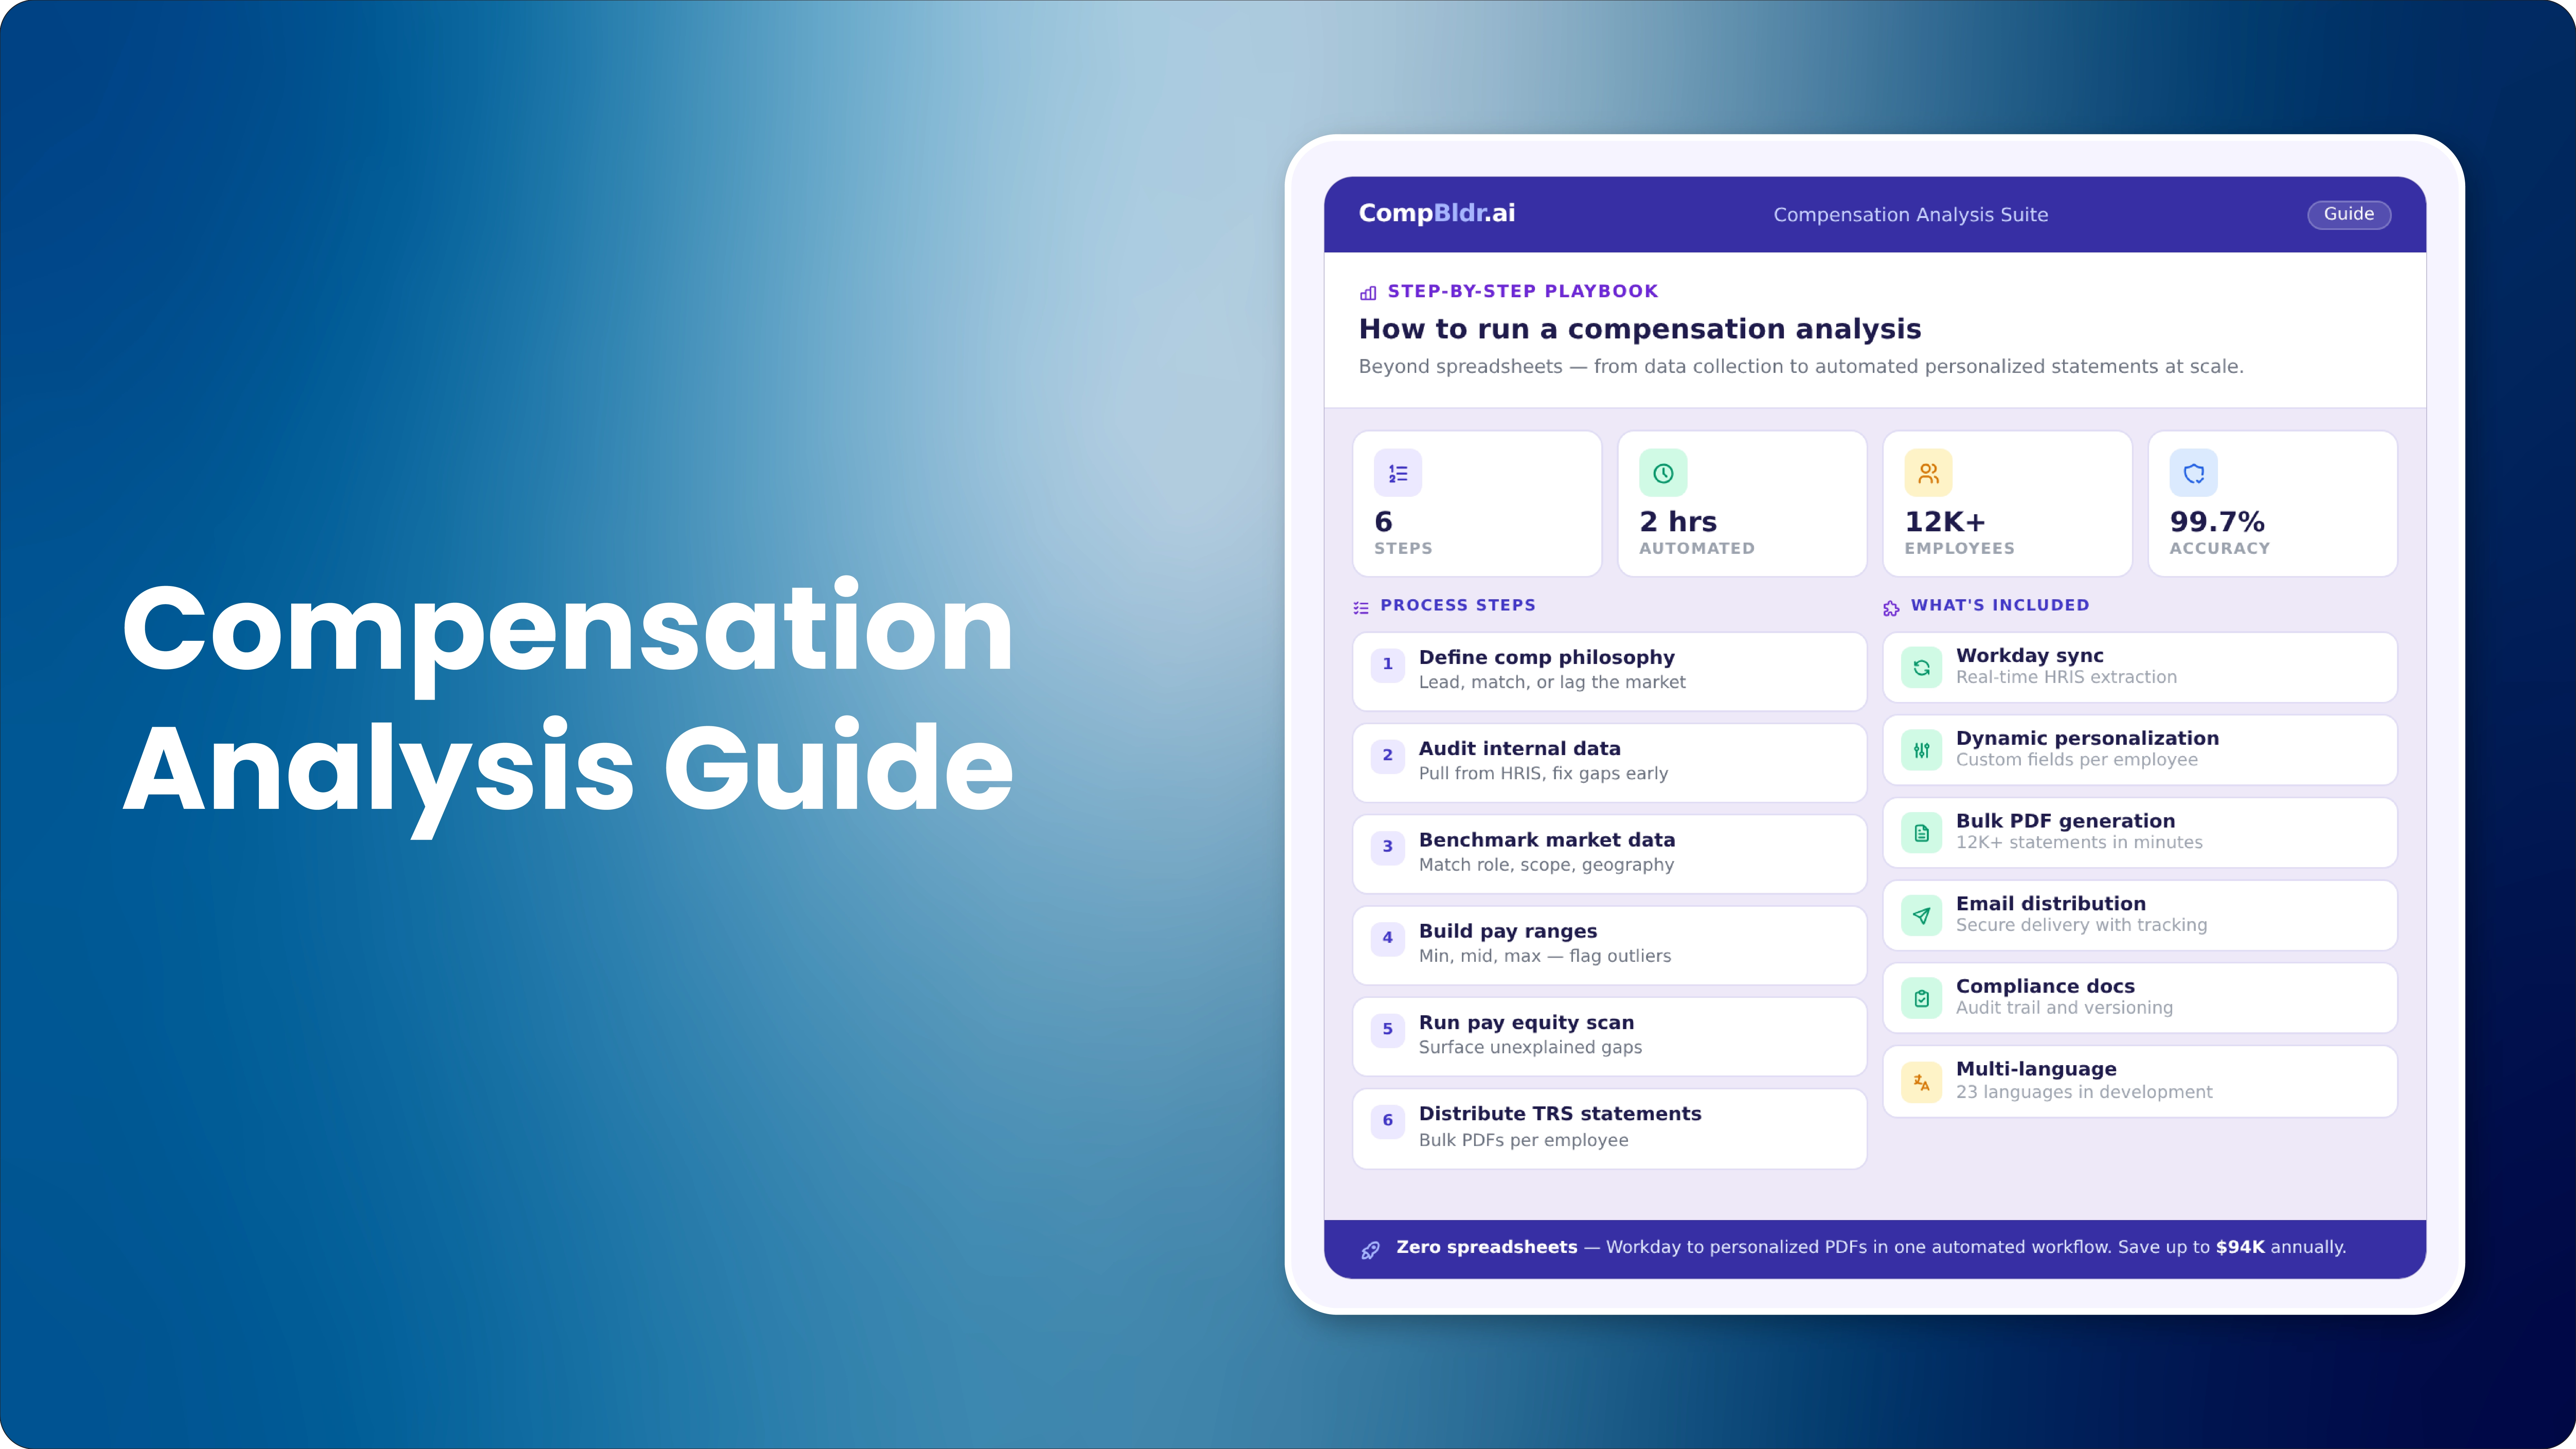
Every HR team that searches for a compensation analysis template is trying to solve the same problem: their compensation data is scattered across systems, their instinct is that pay is not as competitive or equitable as it should be, and they need a structured way to find out. The template is a reasonable starting point. It gives the analysis a consistent structure and a place to put the numbers.
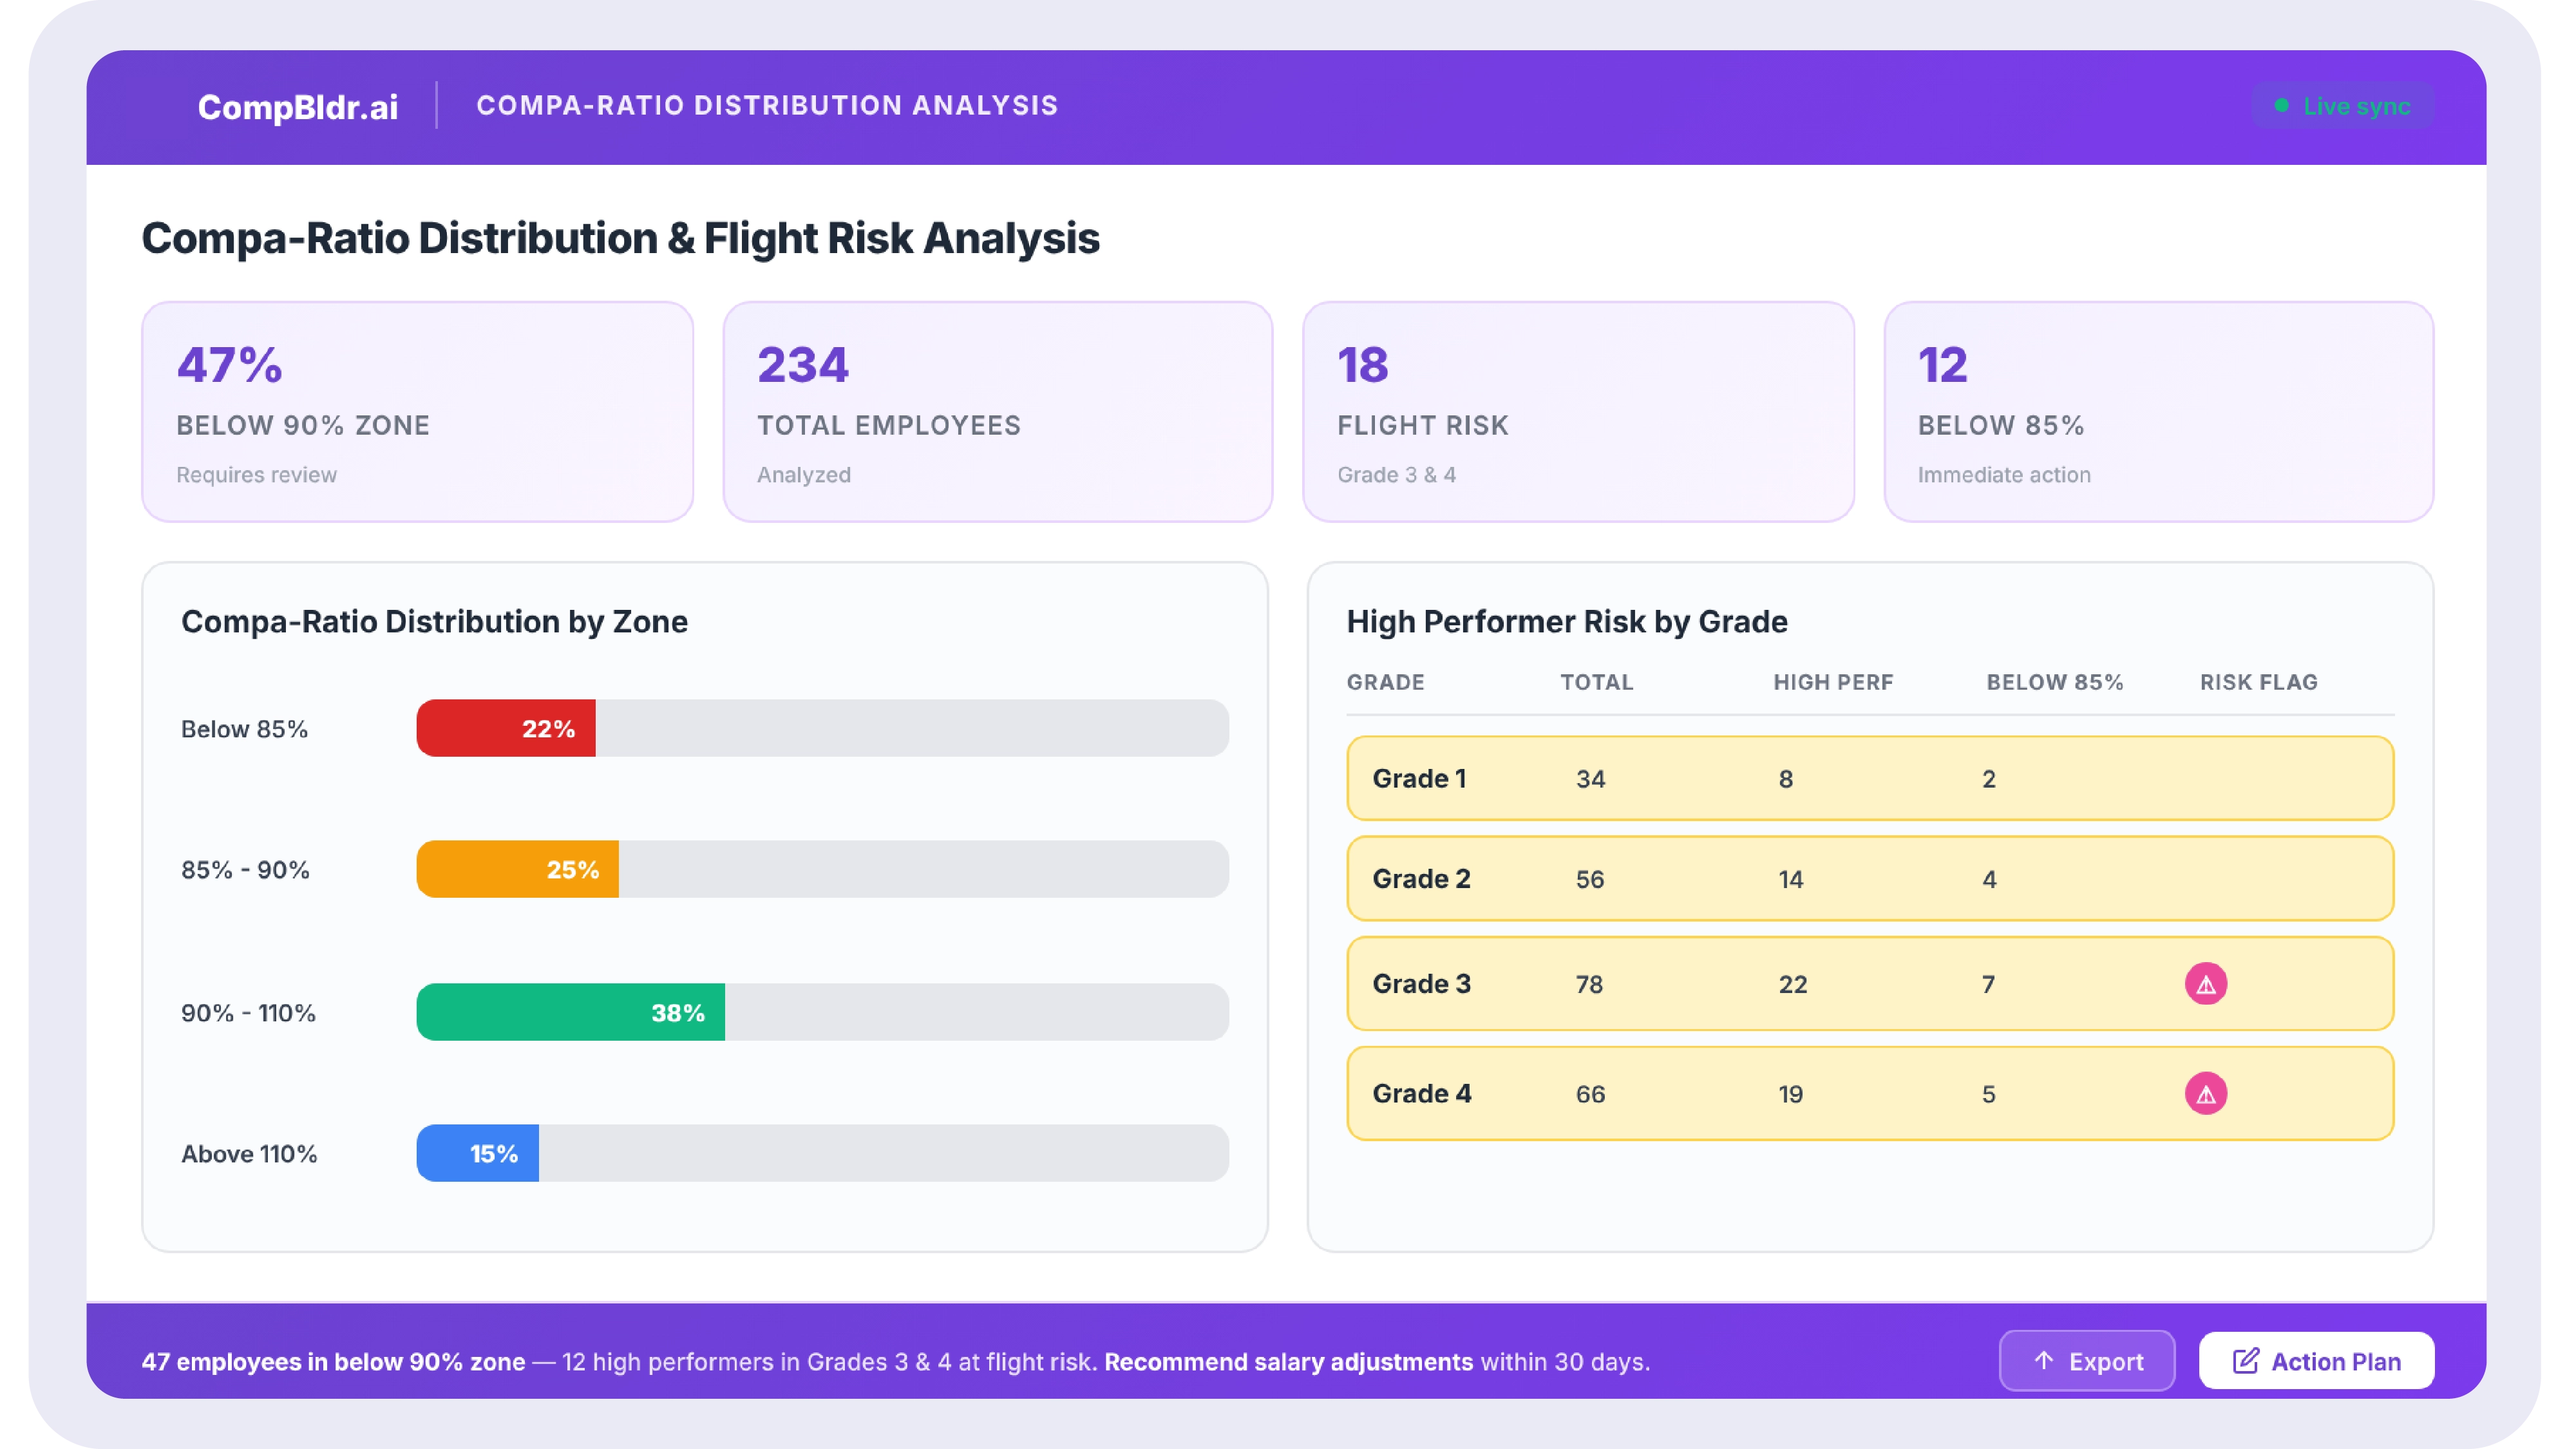
The problem is that most compensation analysis guides stop at the template. They explain what columns to include and how to calculate a compa-ratio. They do not explain what to do when 47 percent of your workforce comes out below 90 percent compa-ratio. They do not explain how to prioritize 200 employees who all need attention. They do not explain how to present findings to a CHRO who has 10 minutes, a CFO who wants a cost estimate, and a set of managers who need to know what to say to their teams.
This guide covers all of it: the six steps of a complete compensation analysis, how to interpret the output at a population level rather than an individual level, how to build a prioritized remediation plan with cost estimates, and when a one-time spreadsheet analysis becomes a governance problem that requires a platform rather than a template.
What Is a Compensation Analysis?
A compensation analysis is a structured review of an organization's pay practices against three benchmarks: external market rates for comparable roles, internal equity across demographic groups within the same grade, and each employee's position within their salary band. It produces a compa-ratio for every employee, a market competitiveness assessment by job family, a pay equity finding by grade and demographic dimension, and a prioritized remediation list with cost estimates. A complete compensation analysis culminates in three separate outputs: a CHRO governance summary, a Finance cost summary, and a manager communication brief.
Why a Spreadsheet Template Is Not Enough
Templates collect data. Analysis produces decisions.
A compensation analysis template gives you a structure for organizing compensation data: employee names, job titles, grades, current salaries, market reference points, and compa-ratio calculations. That is data collection. Analysis is what happens after the data is in the template: interpreting what the distribution means, identifying which employees are at risk, understanding why the gaps exist, and deciding what to do about them in a sequence that Finance will fund and managers can communicate.
The gap between data collection and analysis is where most compensation reviews fail. HR teams produce a spreadsheet with 300 rows of compa-ratio calculations and present it to the CHRO as the compensation analysis. The CHRO asks: What does this mean, what are we going to do about it, and what will it cost? Those questions require interpretation and prioritization that no template column provides automatically.
The three questions a compensation analysis must answer
A complete compensation analysis answers three questions. First: Are we paying competitively? This requires comparing salary band midpoints to current market survey data for each job family and calculating whether the gap is within an acceptable tolerance. Second: Are we paying equitably? This requires comparing average compa-ratios across demographic groups within the same grade to identify systematic underpayment patterns. Third: Which specific employees are at retention risk because of their pay position? This requires a prioritized list of employees below a defined compa-ratio threshold whose performance ratings indicate they are flight risks, not performance problems.
Step 1: Define the Scope and Pull Clean Data
What data do you need, and where does it live
A compensation analysis requires four data sets: employee compensation data (base salary, bonus target, grade, job title, department, location, hire date, FTE status) from the HRIS; salary band data (minimum, midpoint, maximum for each grade) from the compensation governance platform or a salary survey source; market reference data (50th percentile for each job family from Radford, Mercer, or WTW) from the most recent survey cycle; and demographic data (gender, race and ethnicity, or other legally relevant dimensions) from the HRIS for the pay equity check. If any of these four data sets is missing or outdated, the analysis output will be unreliable.
The data quality problems that corrupt the analysis
Three data quality problems produce compensation analysis outputs that cannot be acted on. The first is inconsistent grade assignment: if employees in similar roles across departments are assigned to different grades because managers made independent grade decisions, compa-ratio calculations will be meaningless across departments. The second is stale market data: using survey data from two or more years ago for fast-moving job families such as AI engineering or clinical nursing will produce market competitiveness ratios that understate how far below market the salary bands have fallen. The third is incomplete demographic data: if 30 percent of employee records have missing or inconsistent demographic fields, the pay equity check will be unreliable for the dimensions with the highest coverage gaps.
Step 2: Calculate Compa-Ratios for Every Employee
The compa-ratio formula
Compa-Ratio = (Employee Annual Base Salary / Salary Band Midpoint for Grade) x 100. A result of 100 means the employee is paid exactly at the midpoint. Below 90 means the employee is paid at less than 90 percent of the market anchor for their grade. Above 110 means the employee is paid above the midpoint, which signals compression risk for the grade if other employees in the same grade are significantly below the midpoint.
How to read the distribution, not just individual scores
The individual compa-ratio score tells you where one employee sits relative to their band midpoint. The distribution tells you whether your compensation program is functioning as designed across the entire population. The four zones are: below 80 percent (significant underpayment, high flight risk for any performer above the Does Not Meet threshold); 80 to 89 percent (below midpoint, developing or new to role normal for recent hires but concerning for tenured employees); 90 to 110 percent (target zone, competitive pay); above 110 percent (above midpoint, potential compression problem for the grade).
What the distribution tells you is that individual scores do not
If 40 percent of your workforce is below 90 percent compa-ratio, the problem is not 40 individual pay decisions. It is a structural gap between where salary bands were set and where current salaries have drifted after multiple years of merit cycles at 3 to 3.5 percent annual increases, while market rates for many job families moved faster. Identifying this as a structural problem rather than a collection of individual outliers determines the solution: you need a market adjustment program funded separately from the merit budget, not a series of one-off manager requests for exceptions.
Step 3: Run the Market Benchmark Comparison
How to match roles to survey positions correctly
The most common error in market benchmark comparison is title-based matching: finding the survey position with the closest title to the internal role name and using that position's data as the market reference. Title-based matching produces significant errors for senior and specialized roles because the same title covers very different scopes and accountability levels across organizations. A Senior Engineer at a 50-person startup and a Senior Engineer at a 5,000-person enterprise are not the same role. Matching both to the same Radford survey position produces market reference points that are wrong for one or both.
Architecture-based matching uses the evaluated attributes of the role (job family, grade, scope, level of supervision, decision-making authority) to identify the survey position. This requires a documented job evaluation behind the grade placement, which is why organizations that skip formal job evaluation also produce unreliable market benchmark comparisons.
What market competitiveness ratio tells you about your salary bands
Market Competitiveness Ratio = (Salary Band Midpoint / Market Survey P50 for Job Family) x 100. A ratio above 100 means the salary band midpoint is above the market 50th percentile for that job family. A ratio below 90 means the band midpoint is more than 10 percent below market, which signals that employees in that family are structurally underpaid relative to the current market and that a band update is required before the next merit cycle. Separating this from compa-ratio is important: an employee can have a high compa-ratio (well-positioned within their band) and still be paid below market if the band midpoint itself is below market.
Step 4: Conduct the Pay Equity Check
Unadjusted vs adjusted gap, which number matters for compliance
The unadjusted pay gap is the raw difference in average or median compensation between demographic groups across the full population, without controlling for grade, tenure, or performance. The adjusted pay gap controls for these legitimate factors and shows only the difference that remains after they are accounted for. The unadjusted gap is required for disclosure under the UK Gender Pay Gap Report, EU Pay Transparency Directive, and California CRD pay data report. The adjusted gap is the number that matters for pay equity legal exposure: an adjusted gap above 3 to 5 percent within a grade cluster signals that pay decisions are producing systematically different outcomes for one group, even after controlling for the factors that should legitimately explain pay differences.
How to identify pay equity risk without a regression model
A full statistical regression is the gold standard for adjusted pay gap analysis. But for organizations that do not have a statistician on the HR team, a grade-level compa-ratio comparison by demographic group produces a reliable first screen. The steps are: filter all employees in a single grade; calculate the average compa-ratio for each demographic group within that grade; if the average compa-ratio for one group is more than 5 to 8 percentage points below another group in the same grade, you have identified a pattern that warrants further investigation. This is not a regression-quality analysis, but it catches the most material patterns before any formal statistical work begins.
Step 5: Build the Remediation Priority List
The remediation priority list is the deliverable that transforms a compensation analysis from a documentation exercise into an action plan. It organizes every employee who requires attention into three tiers based on the urgency and cost of correction.
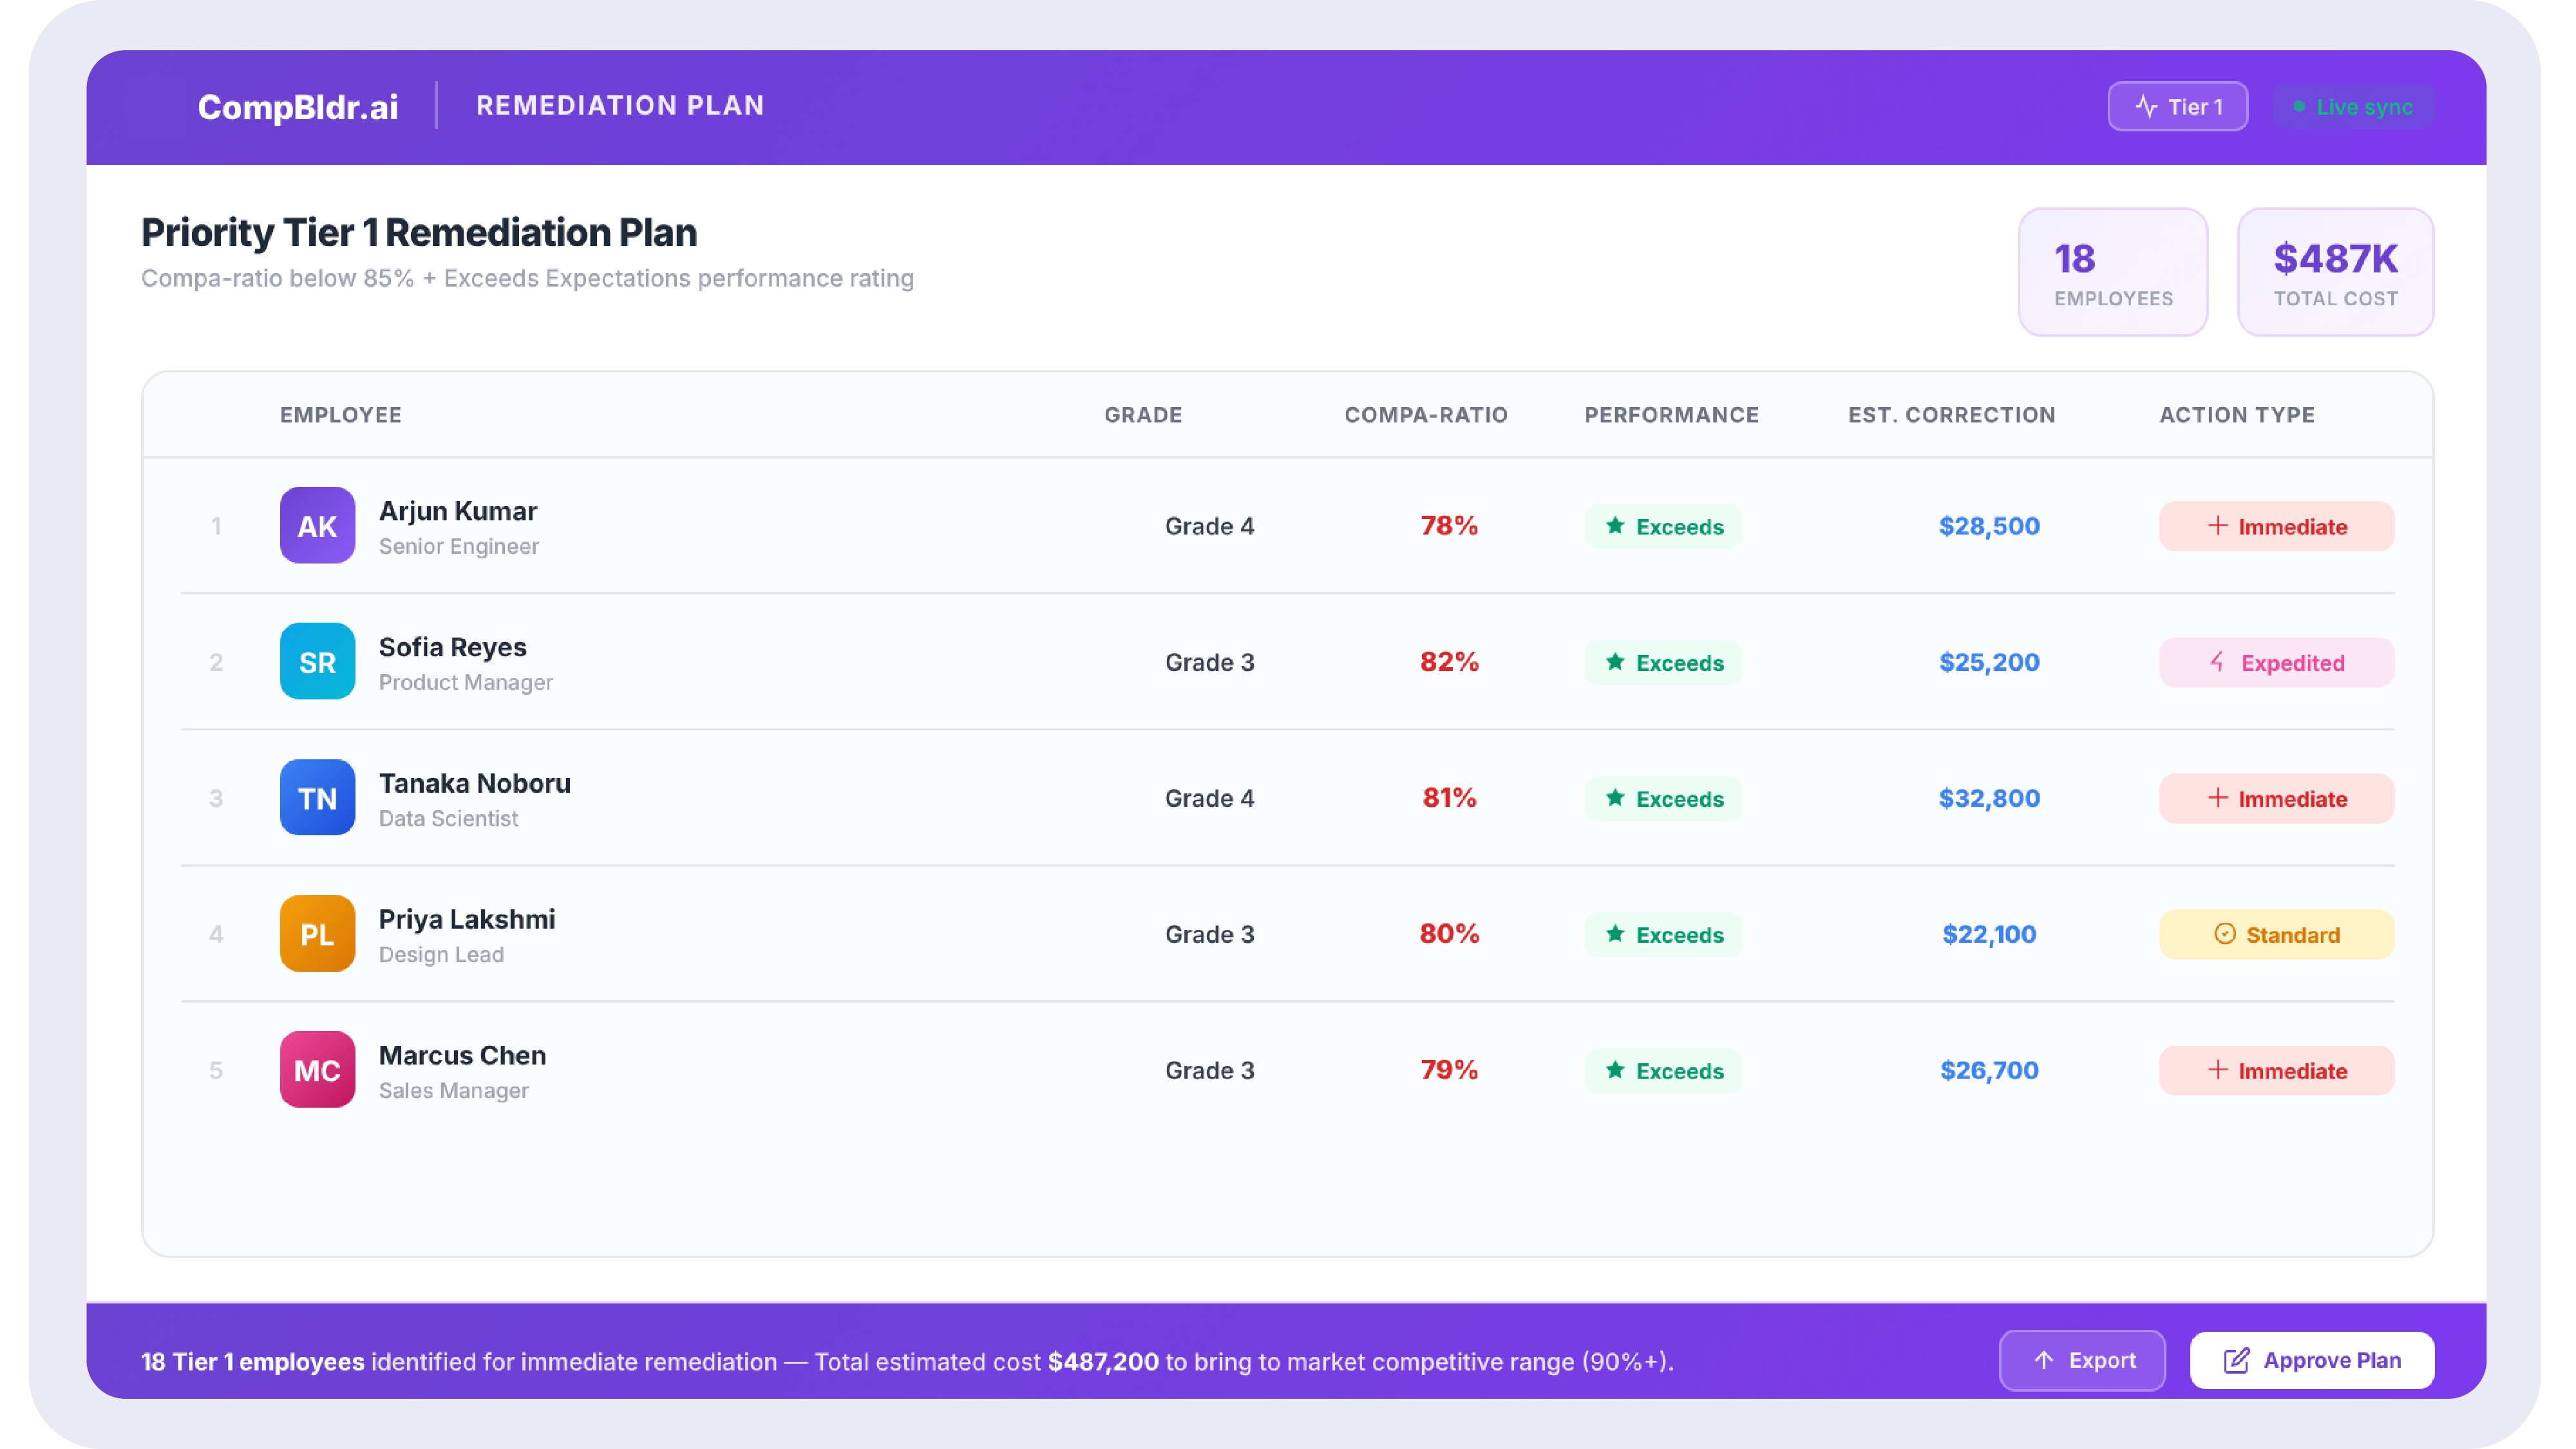
Tier 1: Immediate risk, high performer below 85 percent compa-ratio
Tier 1 employees are the highest remediation priority. They combine two risk factors: a performance rating at Meets Expectations or above (confirmed value to the organization) and a compa-ratio below 85 percent (pay position that makes them easy to recruit away). The cost of replacing a Tier 1 employee, including recruiting, onboarding, and productivity loss, is typically 50 to 200 percent of their annual salary. The cost of a targeted equity adjustment to bring them to a 90 to 95 percent compa-ratio is a fraction of that. Tier 1 corrections should be proposed as off-cycle equity adjustments funded from a dedicated market adjustment budget, not delayed to the next merit cycle.
Tier 2: Structural gap below 90 percent with market lag confirmed
Tier 2 employees are below 90 percent compa-ratio in a job family where the market competitiveness ratio is also below 90 percent, meaning their pay is below the midpoint, and the midpoint itself is below the current market. This is a two-layer structural problem: the employee's pay has not kept pace with their salary band, and the salary band has not kept pace with the market. Tier 2 corrections require two actions: a salary band update using refreshed survey data for the affected job family, followed by an equity adjustment to bring affected employees to a competitive position within the updated band.
Tier 3: Monitor approaching threshold, no immediate action needed
Tier 3 employees are between 90 and 95 percent compa-ratio or have performance ratings that do not indicate immediate flight risk at their current pay position. No immediate action is required, but they should be flagged for priority merit cycle treatment: merit matrix recommendations at the higher end of the recommended range for their performance and pay position zone, to move them toward the midpoint before they cross into Tier 2 territory.
Step 6: Produce the Output That Decision-Makers Actually Use
A compensation analysis that produces one spreadsheet output for all audiences is less effective than one that produces three tailored outputs. The CHRO, Finance, and managers need different information in different formats.
The CHRO summary: three numbers and a recommendation
The CHRO summary contains: the percentage of the workforce below 90 percent compa-ratio by grade (the governance signal), the adjusted pay equity gap for the highest-risk grade cluster (the compliance signal), and the total cost of Tier 1 and Tier 2 remediation as a single number (the budget signal). These three numbers tell the CHRO whether the compensation program is working, whether there is regulatory exposure, and what it will cost to fix the most urgent problems. The recommendation is a single sentence: approve a targeted equity adjustment program of $X funded from the market adjustment budget before the next merit cycle.
The Finance summary: cost of remediation by priority tier
The Finance summary breaks the remediation cost into Tier 1 (immediate action, funded from dedicated budget this quarter), Tier 2 (structural correction, funded from band update and cycle budget next quarter), and Tier 3 (merit cycle management, no incremental budget required). Finance needs to see the total cost, the timing of each expenditure, and confirmation that the market adjustment budget is separate from and does not draw on the approved merit budget.
The manager's summary: what they need to communicate
Managers whose direct reports are receiving equity adjustments need a one-paragraph communication brief: what the adjustment is, why it is happening (a market correction, not a performance recognition), when it is effective, and what the new salary is. Managers should not receive the full analysis, the compa-ratio distribution, or the equity gap data for their peers' teams. They receive only the information about their own direct reports, in a format that enables a five-minute conversation rather than a 30-minute explanation.
When a Compensation Analysis Becomes a Governance Problem
One-time analysis vs continuous monitoring
A compensation analysis run once a year tells you where pay stands as of the analysis date. By the time the remediation plan is approved, funded, implemented, and communicated, three to five months have typically passed. New hires joined at salaries that may not reflect the grade band consistently. Departures changed the demographic composition of grade clusters. The merit cycle ran, changing everyone's compa-ratio. The analysis is already partially outdated.
Continuous monitoring means compa-ratio distribution, market competitiveness, and pay equity gap are tracked from live data at all times, not calculated once a year in a spreadsheet. When a new hire joins at a salary below 85 percent compa-ratio for their grade, the system flags it immediately, not nine months later in the annual analysis. When the market survey refreshes and moves a job family's P50 above the current band midpoint, the system surfaces the band update needed before the next merit cycle opens, not after it closes.
What a platform does that a spreadsheet cannot
A compensation analysis platform provides four capabilities that a spreadsheet cannot replicate. First, it pulls live data from the HRIS without a manual export step, so the analysis reflects the current state of the workforce, not a snapshot from three weeks ago. Second, it applies the analysis methodology consistently every time it runs, so the compa-ratio calculation uses the same band midpoints, the market benchmark uses the same survey blend weights, and the pay equity comparison controls for the same variables, producing results that are comparable across time. Third, it flags new risks as they emerge during normal workflow, not only during an annual analysis cycle. Fourth, it produces the three output formats (CHRO, Finance, and manager) from the same underlying data, eliminating the manual translation layer that typically introduces errors between the analysis and the communication.
How CompBldr Runs a Compensation Analysis From Live Data
CompBldr's compensation analysis runs from the same live data that governs salary bands, merit cycles, and HRIS integration. The compa-ratio distribution is calculated automatically against current HRIS-synced salaries and the governed salary band midpoints. The market competitiveness ratio is recalculated every time a salary band is updated from refreshed Radford, Mercer, or WTW survey data. The pay equity check runs against the current compa-ratio distribution by grade and demographic dimension. The TrAI equity monitoring layer flags patterns as they emerge during the merit cycle, supplementing the annual analysis with real-time detection.
The remediation priority list is generated from the current compa-ratio data and performance rating records, with Tier 1 and Tier 2 employees automatically identified based on configurable thresholds. The cost estimate for each tier is calculated from the current salary data and the correction amount needed to reach the target compa-ratio. The CHRO summary, Finance summary, and manager communication brief are report exports generated from the same underlying analysis data, not separately assembled documents.
A compensation analysis template gives you the structure to organize your data. This guide has covered what to do with that data: calculate and interpret the compa-ratio distribution as a population-level governance signal, run the market benchmark comparison using architecture-based matching rather than title lookup, conduct a grade-level pay equity check that surfaces material patterns without a regression model, and build a three-tier remediation priority list with cost estimates by tier.
The output of a complete compensation analysis is not a spreadsheet. It is three documents: a CHRO governance summary, a Finance cost summary, and a manager communication brief. When those three outputs are produced from the same data and reflect the same analysis, compensation decisions are made consistently and communicated clearly.
For organizations that run this analysis once a year in a spreadsheet, the annual cycle produces a documentation record. For organizations that run it continuously from live data in a governed platform, it produces the real-time governance infrastructure that prevents the problems a one-time analysis finds.


.webp)
.webp)

.svg)

.svg)
.svg)

