
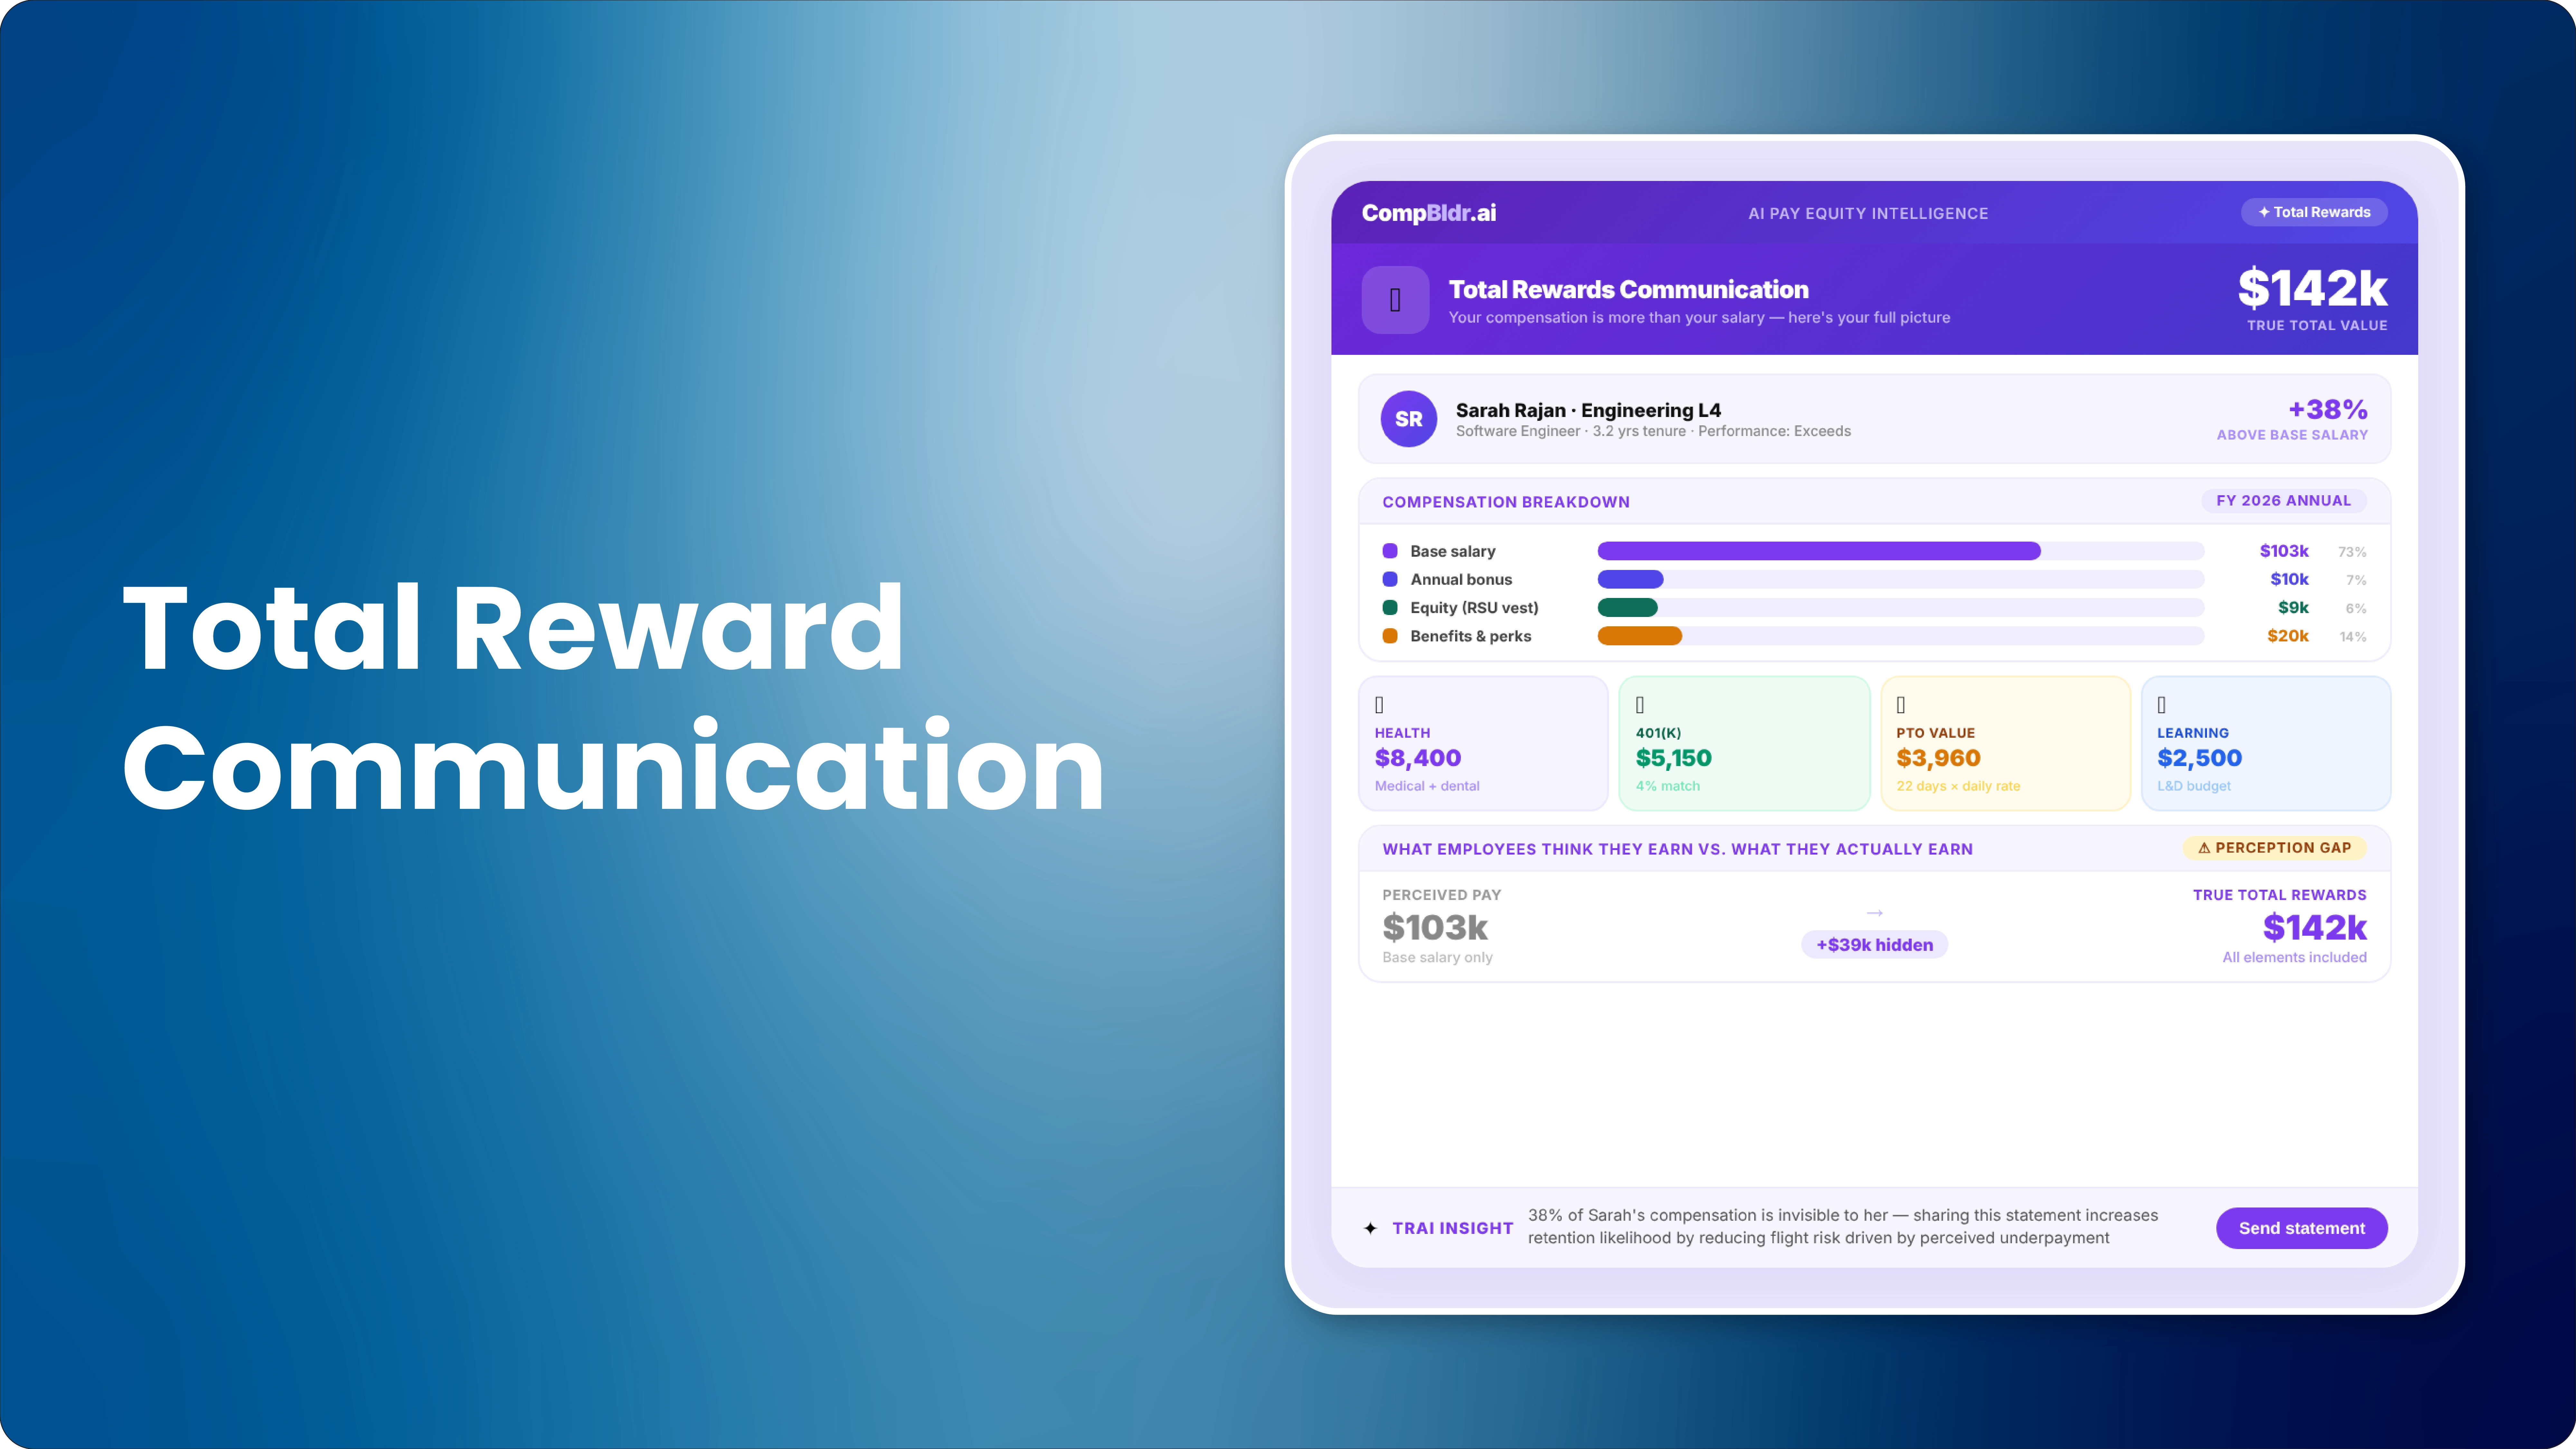
A senior engineer earning $142,000 in base salary with a $14,000 target bonus, $24,000 in annualised RSU value, $21,000 in employer-paid health insurance premiums, and a $7,000 annual 401k match has a total annual compensation of $208,000. Most employees only see the $142,000. They compare it to Glassdoor, see similar roles listed at $155,000 somewhere, and begin to question whether they are being paid fairly. The $66,000 difference between what they see and what they actually receive is invisible because no one has shown it to them.
A total rewards statement makes the full picture visible in one document. It does not change the compensation. It changes the employee's understanding of the compensation, which changes their perception of whether they are being paid fairly. For HR teams managing retention in a competitive labour market, the total rewards statement is the communication tool that recovers the perceived equity gap without requiring a budget-breaking base salary increase.
This guide covers exactly what to include, how to calculate the value of each component, what communication methodology produces the highest engagement, and how to automate per-employee statement generation so the process does not require a manual project every year.
Why Employees Systematically Undervalue Their Compensation?
The base salary anchor problem
Employees are anchored to base salary because it is the number on their pay stub and the number they share with peers. Every external comparison they make, whether it's a Glassdoor listing, a conversation with a recruiter, or a LinkedIn salary insight, uses base salary as the unit of comparison. Benefits, equity, and employer retirement contributions are invisible in these comparisons because they are not on pay stubs, they are not posted on Glassdoor, and they are not what recruiters quote in the headline number.
What research says about perception gaps in total compensation
Research on compensation perception consistently shows that employees substantially undervalue non-cash components of their total compensation. Employer-paid health insurance premiums, which typically represent $15,000 to $25,000 in annual value for a family plan, are rarely factored into employees' mental accounting of their total pay. 401k matching contributions, which can represent an additional 3 to 6 per cent of base salary annually, are routinely not counted by employees when calculating whether their pay is competitive. The result is a persistent perception gap: employees feel less well-compensated than they actually are when their complete package is valued.
How the perception gap connects to voluntary attrition
Voluntary attrition interviews consistently rank compensation dissatisfaction as a primary factor, even for employees whose total compensation is competitive with the market. When an employee accepts a competing offer at a slightly higher base salary, they often fail to account for the fact that their current total compensation (including benefits, equity, and retirement contributions that vest with tenure) exceeds the competing package. A total rewards statement delivered at the point where an employee is making this comparison provides the information needed for an accurate evaluation, rather than a base-salary-only comparison that systematically understates the current employer's value.
What a Total Rewards Statement Includes
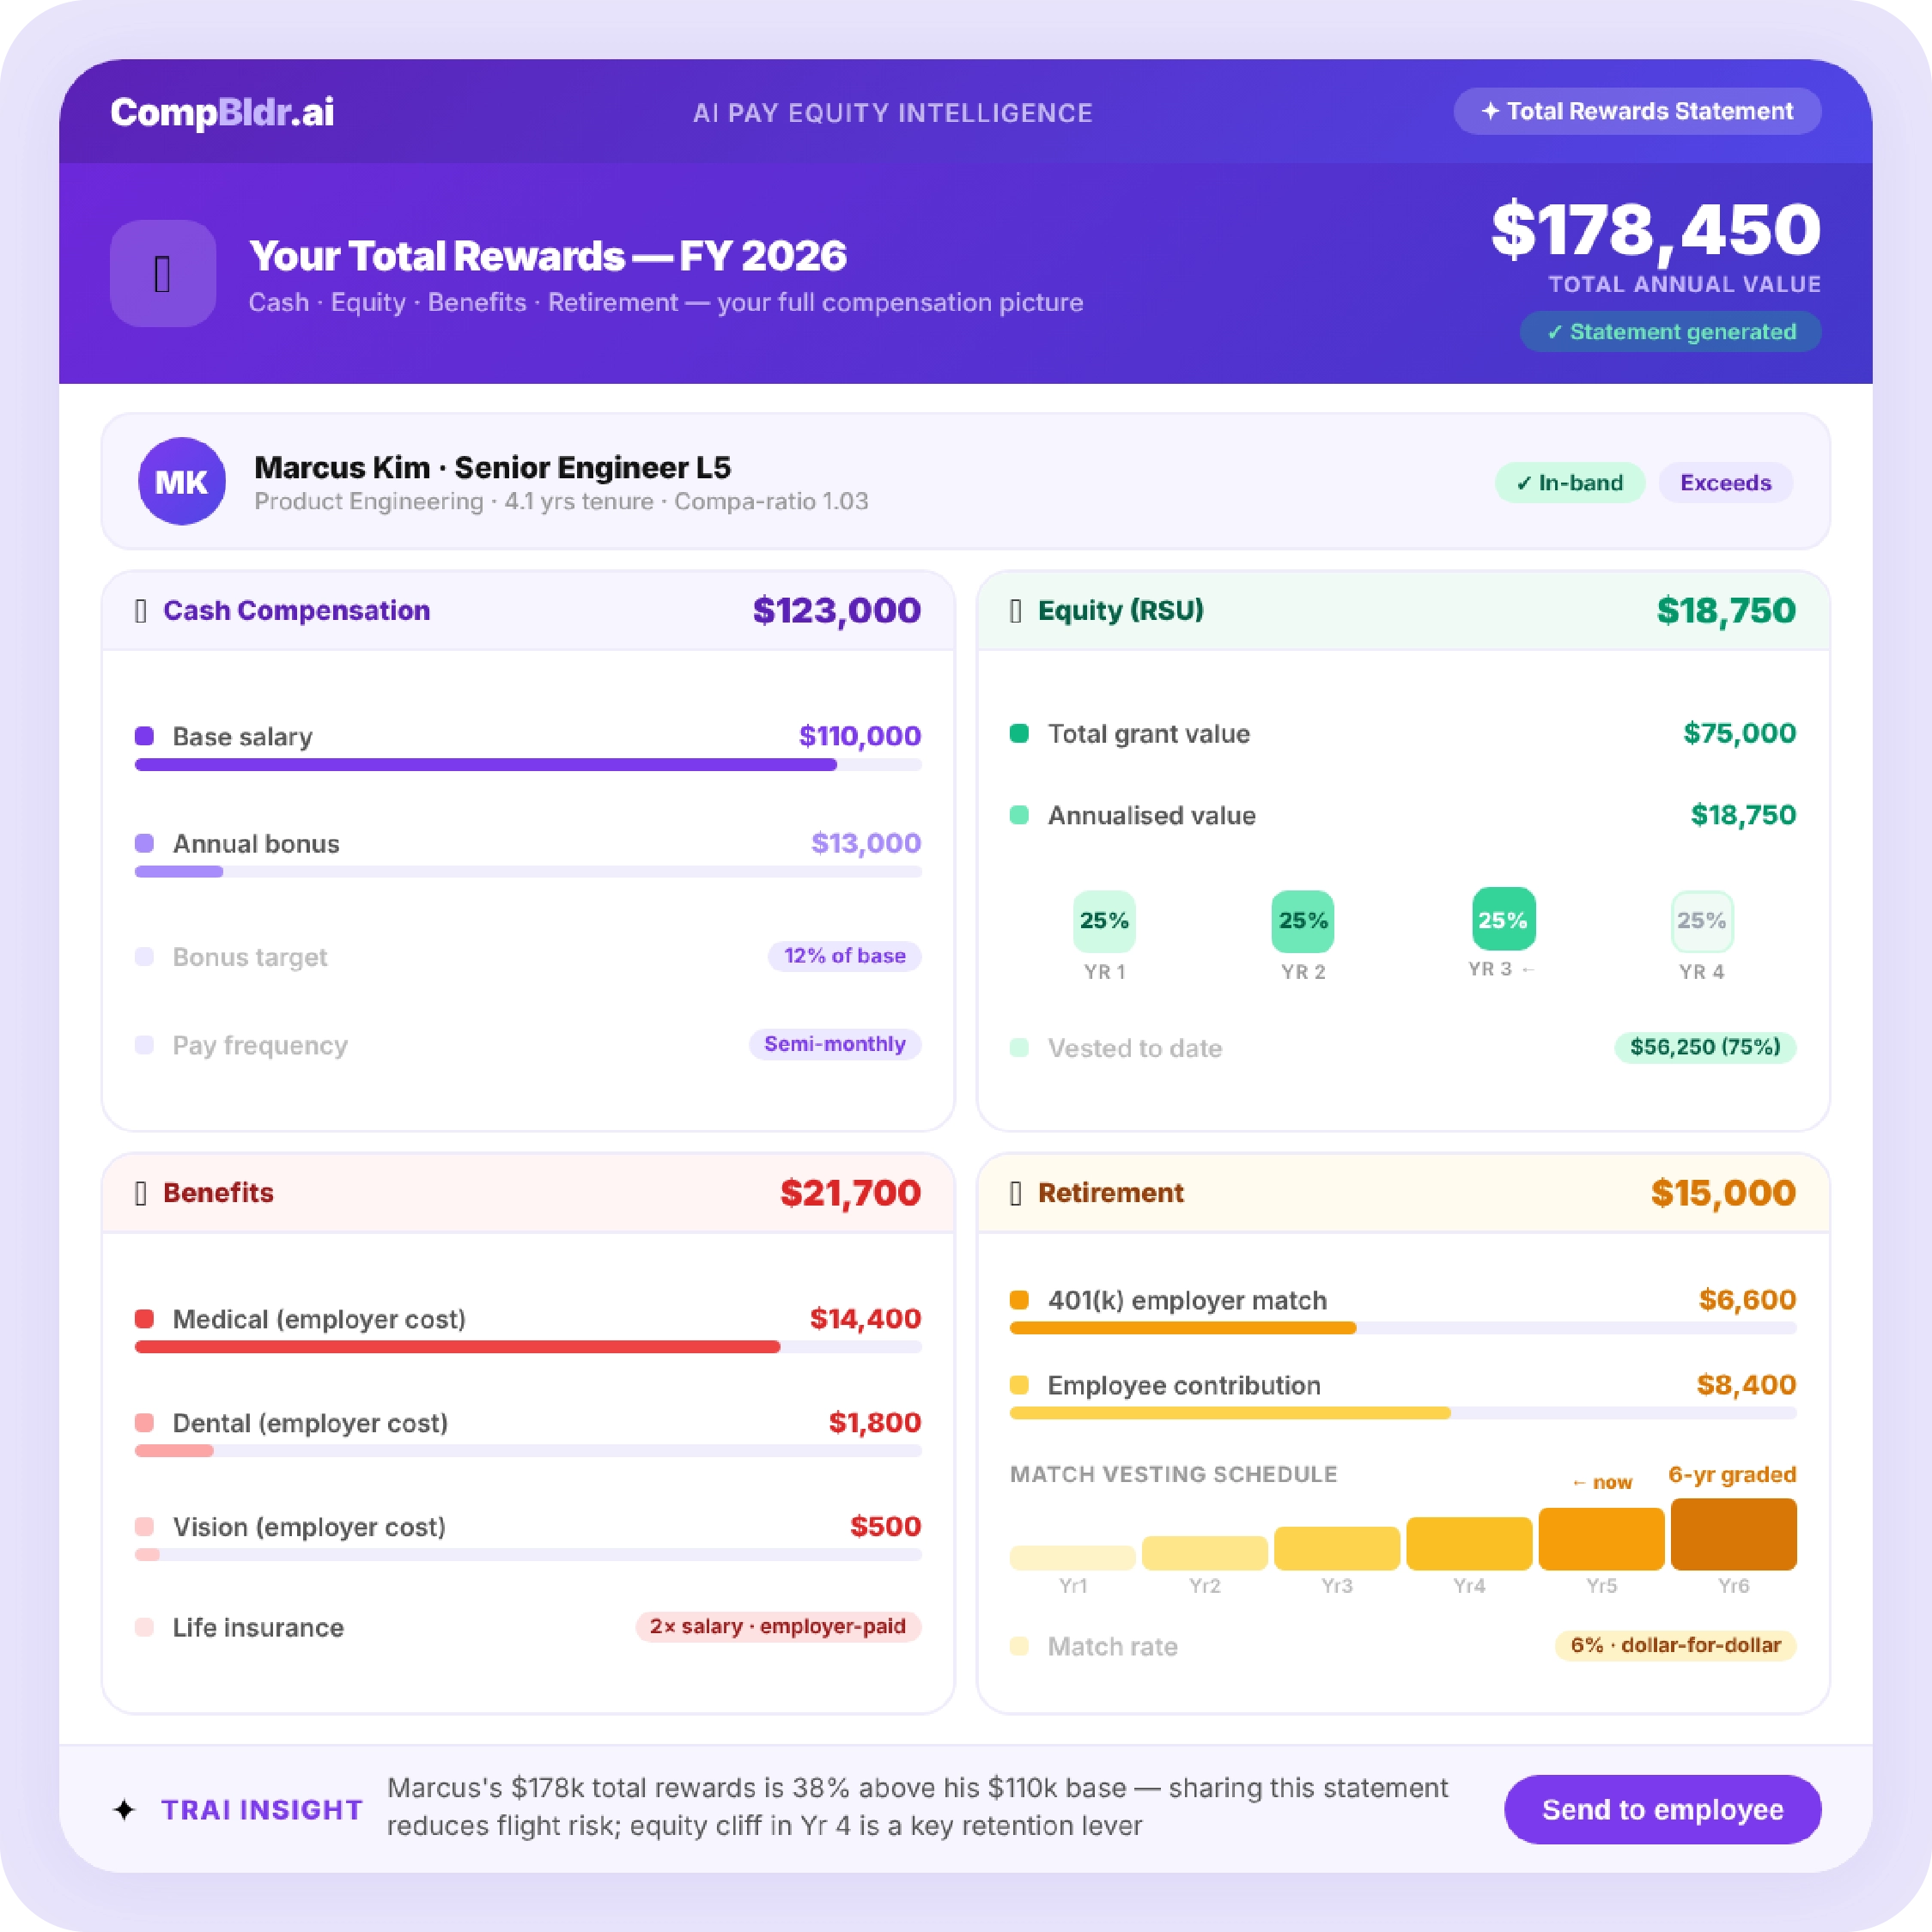
Cash compensation: base salary and target short-term incentive
List the current annual base salary and the target annual bonus or commission amount. For employees with a variable bonus, use the target (100 per cent of plan) rather than actual payout, and note that the target is based on defined performance criteria. For sales employees with commissions, use the target total cash compensation (base plus on-target earnings). Clearly label each component and provide the total cash compensation (TCC) subtotal.
Equity compensation: RSUs, stock options, and annualised value
For employees with equity grants, show each grant with its grant date, vesting schedule, current share price (or 409A fair market value for private companies), and the annualised value (total grant value divided by the vesting period in years). Include both unvested grants and the portion that vested in the current year. For stock options, show the strike price and the current intrinsic value if the options are in the money. The equity section often produces the largest single reveal in a total rewards statement, particularly for employees with multiple overlapping grants from annual refresh cycles.
Benefits: employer-paid premiums and the dollar value most employees never see
This is the section with the biggest perception gap. List the employer's annual premium contribution for each benefit plan the employee is enrolled in: medical, dental, vision, life insurance, disability insurance, and any supplemental insurance programs. Use the actual employer-paid cost, not the premium the employee pays. A family-coverage medical plan where the employer pays $21,000 per year in premiums may show as $0 on the employee's pay stub because it is a pre-tax payroll deduction. When an employee sees that their employer is paying $21,000 annually toward their health insurance, the response is frequently one of surprise.
Retirement contributions: 401 (k) match, pension, and vesting schedules
List the employer's annual 401 (k) matching contribution at the employee's current contribution level, and note the vesting schedule and current vested percentage. For employees who are partially vested, showing the unvested balance that would be forfeited if they leave creates a tangible retention incentive. Include any pension accruals, employer-funded HSA contributions, or other retirement-adjacent contributions separately.
Additional perquisites: PTO value, wellness allowance, professional development
Calculate the cash value of the employee's PTO balance at their daily rate. List any wellness stipends, home office allowances, mobile phone allowances, transportation benefits, and professional development reimbursement at their annual cash value. For employees receiving these benefits, seeing them expressed as an annual dollar amount is often surprising. A $2,400 annual wellness stipend, $1,200 home office allowance, and $3,000 professional development budget represent $6,600 in additional annual value that most employees count as zero in their mental compensation calculation.
Deliver Personalized Total Rewards Statements Automatically
Show employees the full value of salary, incentives, benefits, equity, and retirement contributions in one individualized statement.
How to Calculate the Value in Each Section?
Calculating annualised equity value for pre-vested RSUs
Annualised RSU value = (Number of unvested RSUs x Current share price or 409A FMV) / Remaining vesting years. For an employee with 2,000 unvested RSUs at a current price of $40 per share with 3 years remaining on the vesting schedule, the annualised value is (2,000 x $40) / 3 = $26,667. For employees with multiple overlapping grant cycles (common in organisations that issue annual refresh grants), add the annualised values from each grant. This produces a single total annualised equity figure that reflects the employee's actual annual equity income from all grants combined.
Calculating employer benefits costs the right way
Use the actual employer-paid premium from your benefits invoicing, not an estimate or a blended average. Employees enrolled in family coverage and employees enrolled in employee-only coverage pay very different premiums and should see very different numbers in their statements. Applying a blended average to all employees produces inaccurate figures that understate the value for some employees and overstate it for others. Most HRIS systems store the elected benefits plan for each employee. CompBldr pulls this data from the HRIS integration and applies the correct premium for each employee's elected plan automatically.
What to do when values are variable or uncertain?
For components with genuinely uncertain values (unvested equity in a pre-IPO company, pension accruals in an ongoing plan), use the most recently published valuation (409A for private company equity, actuarial report for pension) and label it clearly as the value as of a specific date. For variable bonus, use target and label it as such. Transparency about how each value was calculated builds trust in the total figure. An employee who understands that the $24,000 equity value is based on the most recent 409A valuation will not assume it is the current market value.
The Communication Methodology: When, How, and to Whom
Annual delivery aligned with the merit cycle close
The most effective delivery timing for total rewards statements is immediately after the merit cycle closes, when employees are already thinking about their compensation. Delivering the full total rewards picture at the same time as the merit increase communication connects the two: the merit increase is placed in the context of the full compensation package. An employee who learns their base salary increased by $6,500 while simultaneously seeing their total compensation is $208,000 has a different reaction than one who only sees the $6,500 increase in isolation.
What delivery format works better than PDF?
Payscale's research on total rewards statement delivery shows that interactive digital statements produce higher engagement than static PDFs. An interactive format allows employees to see the breakdown of their total compensation with expandable sections for each component, a total figure that updates as they explore, and explanatory tooltips for components they may not understand (such as what an RSU is or how the 401k match calculation works).
The manager enablement conversation that makes statements land
A total rewards statement delivered without a manager context often produces questions rather than the intended impact. Managers who can have a short conversation around the statement explaining what each component represents, answering questions about equity vesting or benefits costs, and connecting the statement to the organisation's compensation philosophy produce dramatically higher positive response rates than statements delivered as a document with no accompanying conversation. PartnerComm's research on total rewards communication identifies the absence of manager enablement as the primary reason total rewards statements fail to achieve their retention objectives.
Signs your current total rewards statement needs an upgrade
Your total rewards statement needs an upgrade if: it shows averaged benefit costs rather than each employee's actual elected plan costs; it does not include equity value because the process for calculating it is too complex; it is produced annually by a manual spreadsheet process that limits personalisation; it includes only cash components; or it is delivered as a single static PDF with no explanatory context. Any of these conditions means the statement is not showing employees their true total compensation.
What Payscale's Approach Gets Right and What It Misses?
Templates are useful but not sufficient for automated delivery
Payscale's total rewards statement guide provides useful templates for the structure and content of a statement. What it does not address is the operational challenge of personalising that template for every employee at scale. A 500-person organisation producing individualised total rewards statements requires either a significant manual assembly process or a platform that pulls each employee's actual data from the HRIS and populates the statement automatically. Payscale describes what the output should look like. It does not describe how to produce it efficiently for every employee without a dedicated project team.
The HRIS pull that makes per-employee personalisation scalable.
The difference between a useful total rewards statement and a generic one is per-employee data: the specific health plan an employee elected and what it costs the employer, the specific equity grants they hold with their current vesting status, and the specific 401k contribution rate they have elected and the resulting match. This data lives in the HRIS. A platform that pulls it from the HRIS directly and populates each employee's statement from live data produces accurate, personalised statements for every employee without requiring HR to manually compile data for each one.
How CompBldr Automates Total Rewards Statements?
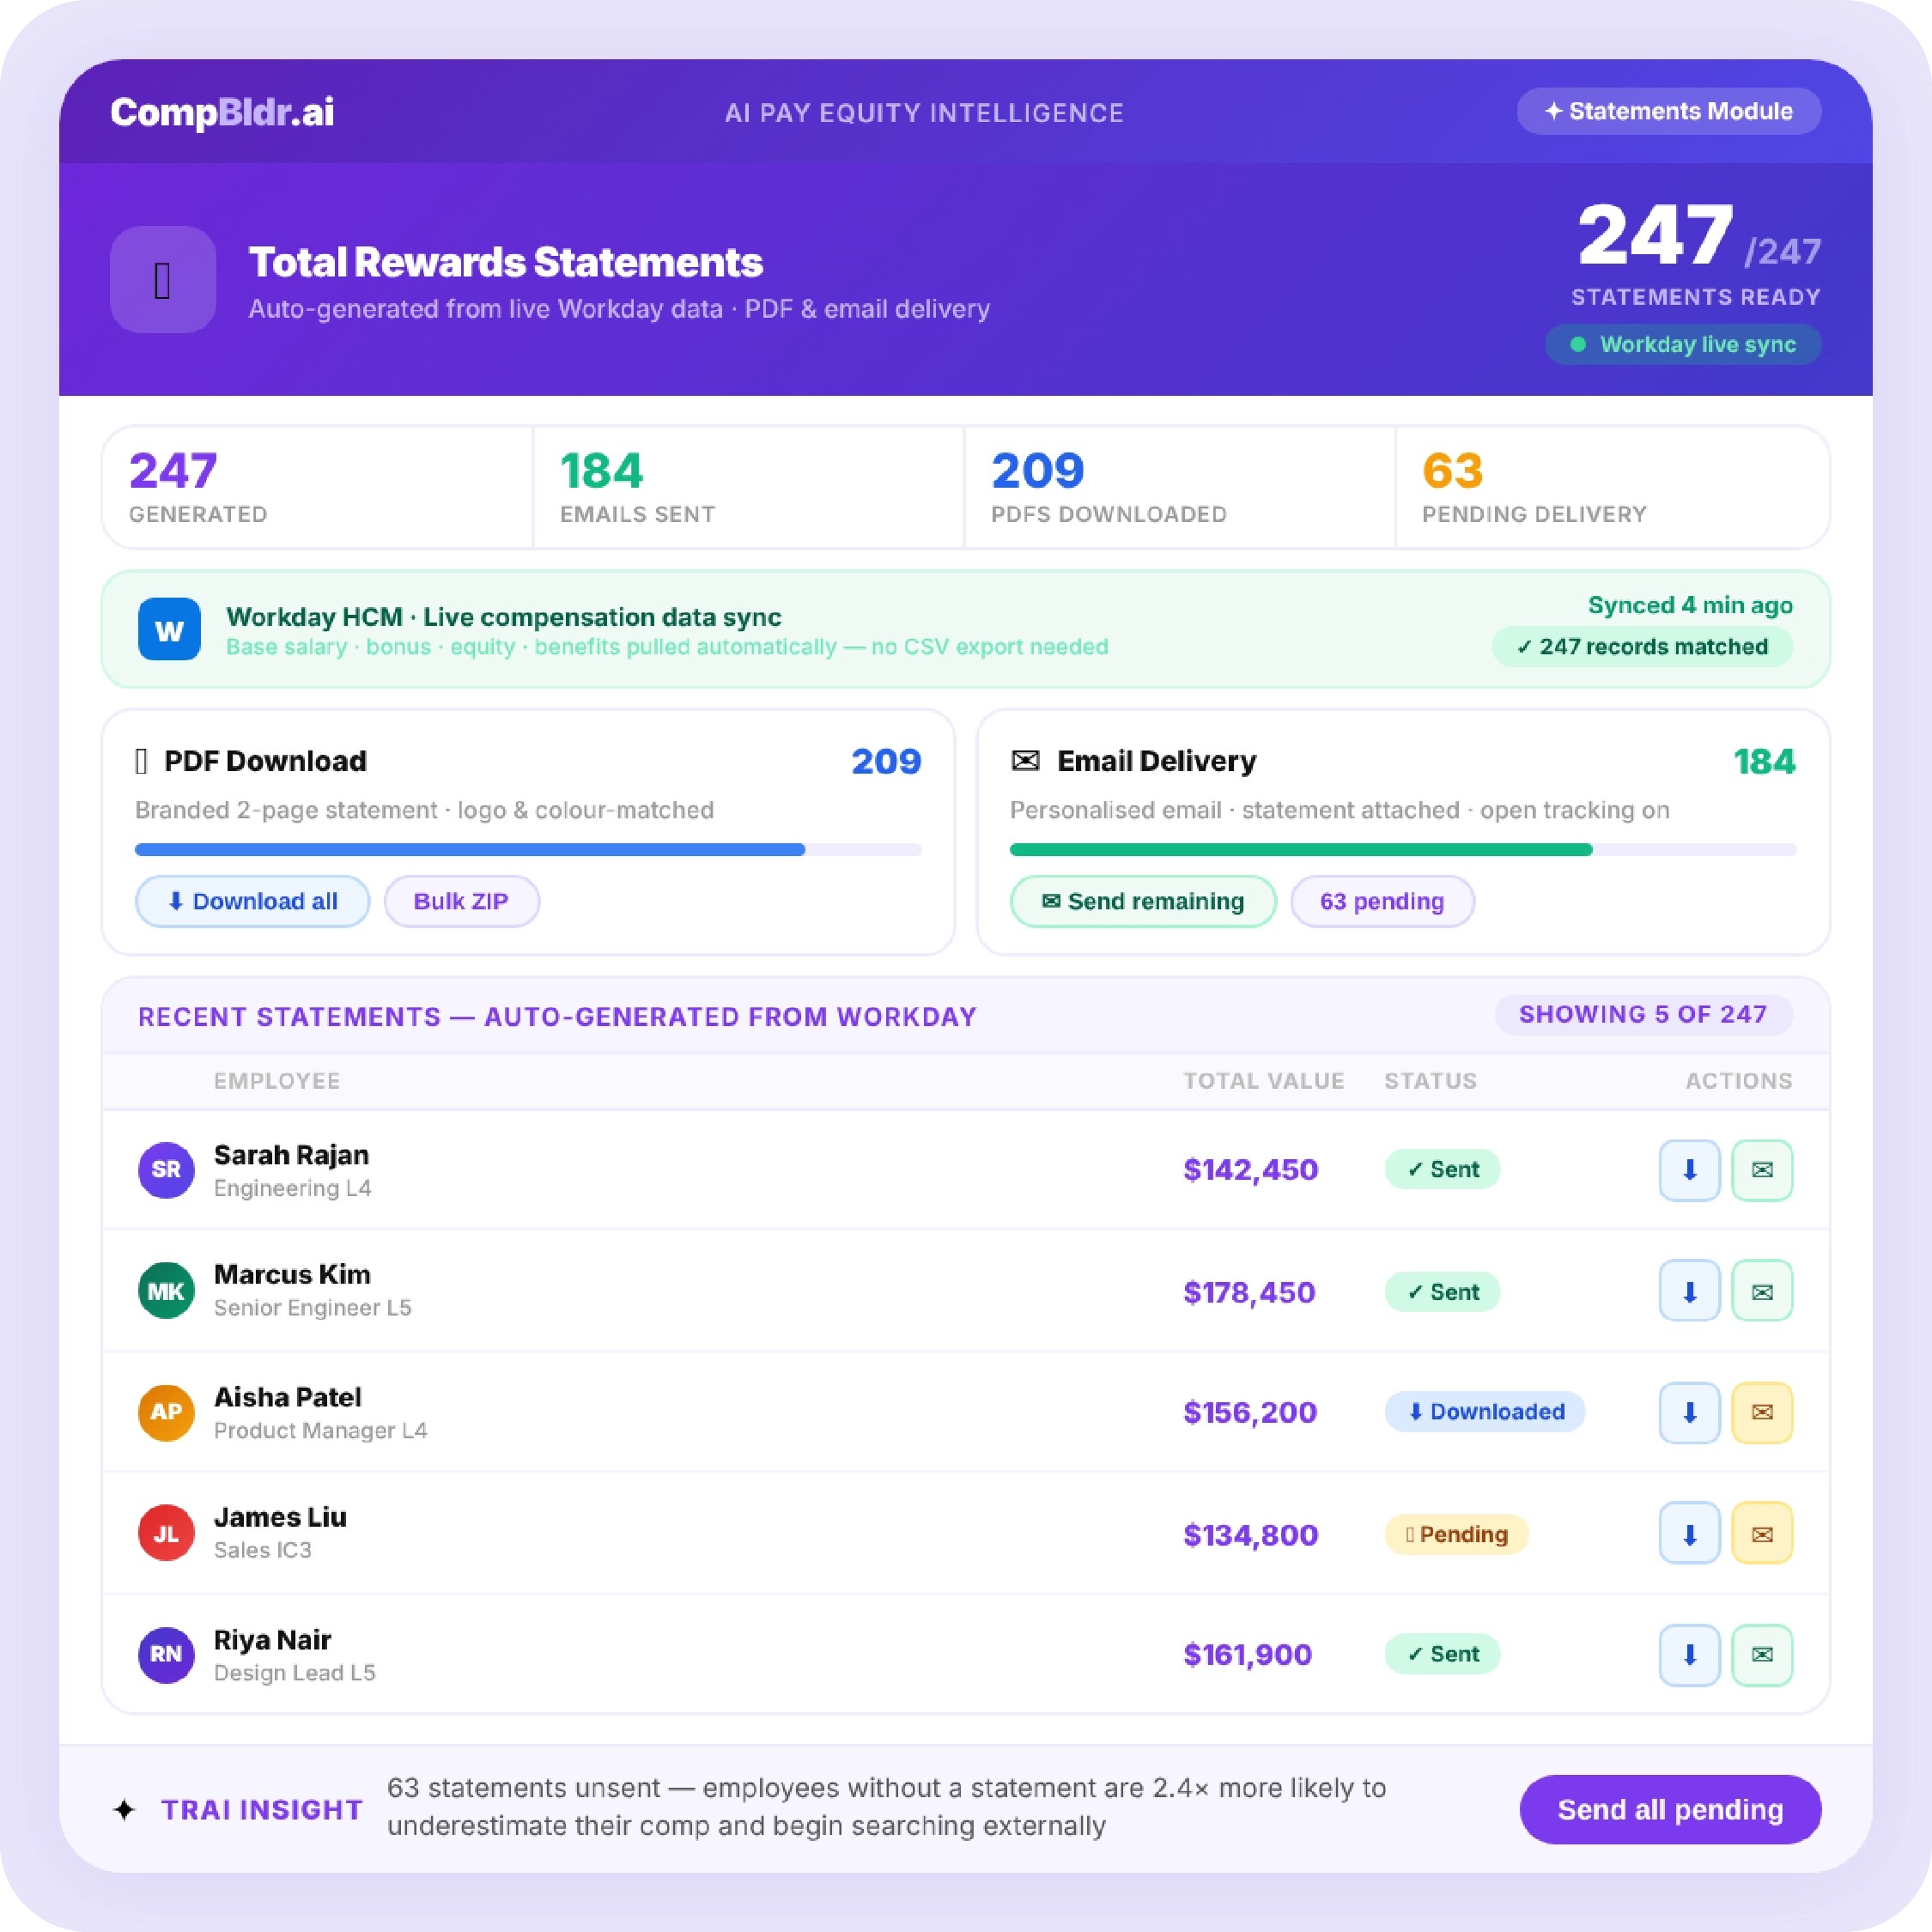
Live data pull from Workday, BambooHR, and Rippling
CompBldr's Total Rewards Statements module connects employee compensation and benefits information within a configurable statement workflow. HR can map the required fields, review the data, and generate individualized statements without rebuilding a separate spreadsheet for every employee.
Per-employee statement generation for any workforce size
Branded delivery with manager note capability
Statements are generated in the organisation's brand with a customizable compensation philosophy summary and a manager note field that allows managers to add a personal message before the statement is delivered to each employee. Delivery options include email, PDF download, or access through the employee portal. HR can track statement opens and completion rates from the CompBldr dashboard to identify employees who have not engaged with their statement and follow up proactively.
No Spreadsheets, No Manual Assembly
Total Rewards Statements - Generated at Scale
See how CompBldr can turn approved compensation and benefits data into clear employee statements without a manual assembly project.
Book a Demo

.webp)
.webp)
.svg)

.svg)
.svg)

