


How to Run a Compensation Analysis: A Step-by-Step Guide for HR Teams

Updated On:
May 11, 2026
Mahesh Kumar
Founder, TraineryHCM.com
How to Run a Compensation Analysis

Table of Contents

What Is a Compensation Analysis?

A compensation analysis is a structured review of an organization's pay structure to determine whether salaries are competitive with the external market, equitable across employee groups, and internally consistent. It examines compa-ratios, market competitiveness by job family, pay equity across demographic groups, salary band validity, and pay compression. A complete compensation analysis produces a prioritized list of remediation actions with quantified costs, enabling HR and Finance to make data-driven decisions about where to invest compensation spend.

When You Need a Compensation Analysis

Before a merit cycle opens

Running a compensation analysis before opening the merit cycle gives HR and Finance visibility into where the budget will have the most impact: which job families are most below market, which employees have the most significant compa-ratio gaps, and where compression exists that will require equity adjustments separate from merit. Without this analysis, the merit budget is allocated based on manager advocacy rather than data.

After a period of rapid hiring

Rapid hiring, particularly in competitive talent markets where new hires are brought in at or above band midpoint, consistently creates compression for tenured employees. A compensation analysis after a hiring surge surfaces the compression before affected employees leave rather than after.

In response to pay transparency law changes

When your organization enters a new state or jurisdiction with pay transparency requirements, a compensation analysis validates that your salary ranges are grounded in documented methodology and defensible against regulatory review before you are required to post them.

Before or after an acquisition

Acquisitions bring together two organizations with different compensation structures, pay philosophies, and grade systems. A compensation analysis of both organizations is the foundation for harmonizing the two structures in a way that is equitable, defensible, and financially sustainable.

Step 1: Define the Scope and Objectives

Before pulling any data, document what the analysis is designed to answer. Is the primary objective market competitiveness, pay equity, compression identification, or a combination? The objective determines which data fields are required, which analyses to run, and what the output should look like. Undefined scope leads to analyses that answer the wrong questions.

Step 2: Gather and Clean Your Compensation Data

Required data fields

Current base salary, job grade and level, job family, demographic information (gender and ethnicity at minimum), location, tenure, most recent performance rating, and date of last salary adjustment. Benefits and equity grant data are required for a total compensation analysis.

Common data quality issues to resolve first

Employees without grade assignments should be reviewed and graded before inclusion. Part-time employees should have their salaries converted to full-time equivalent before comparison. Employees in transition (new hires in first 90 days, employees mid-promotion) may need to be excluded or handled separately. Missing demographic data should be sourced from employment records where available.

Step 3: Audit Your Salary Band Structure

A compensation analysis that calculates compa-ratios without first auditing the salary bands those compa-ratios are based on produces unreliable output. A compa-ratio of 95 percent against an outdated or incorrectly designed band may not signal competitive pay at all. Before compa-ratios are calculated, the bands themselves must be verified as current, consistent, and correctly constructed.

Are your bands anchored to current market data?

Each salary band should have a documented midpoint derived from external compensation survey data (Radford, Mercer, WTW, or equivalent), a stated pay positioning strategy (for example, P50 of the relevant market), a survey blend methodology, and a date of last update. A band midpoint that was set from 2022 survey data without aging adjustments is likely 8 to 20 percent below the current market for most professional and technical job families, depending on the pace of market movement in that function. Bands in fast-moving segments such as AI engineering, machine learning, clinical nursing, and cybersecurity are the highest risk of being materially stale.

The audit step compares each band's current midpoint to the current market reference point (survey P50 aged to the current date) for the relevant job family. A midpoint more than 8 to 10 percent below the current P50 is a candidate for a band update before the compa-ratio analysis runs, because running the compa-ratio against a stale midpoint will systematically understate the true market gap for employees in that family.

Are bands consistently applied across equivalent roles?

The second audit dimension is internal consistency. Roles that perform equivalent work at equivalent scope and accountability levels should be in the same grade and therefore governed by the same salary band. If two Senior Engineers in different departments are in different grades because their managers made independent leveling decisions without a formal job evaluation methodology, the compa-ratio comparison between them will be meaningless: the employee in the higher grade will show a lower compa-ratio not because they are paid less but because their grade band has a higher midpoint.

This audit requires reviewing grade assignments for roles that share a title or similar scope description across departments, flagging grade inconsistencies for resolution before the analysis proceeds, and documenting the evaluation methodology used to assign or confirm grades. For organizations using CompBldr's JESAP framework, every grade assignment has a documented factor score that makes this audit straightforward: if two Senior Engineers have different grades, the factor scores explain exactly why, and the explanation either holds under review or it does not.

What to do when a band fails the audit

Two outcomes require action before the analysis continues. First, if a band midpoint is confirmed to be more than 10 percent below the current market reference, the band should be updated before compa-ratios are calculated. This prevents the analysis from producing remediation recommendations calibrated to a stale target that will need to be revised again after the band update. Second, if grade assignments for equivalent roles are found to be inconsistent, those assignments should be resolved through a documented evaluation before the analysis proceeds. Including employees with incorrectly assigned grades in a compa-ratio analysis produces findings that misidentify the root cause: a compensation problem looks like a grading problem, or a grading problem looks like a compression finding.

Step 4: Calculate Compa-Ratios Across the Organization

Individual compa-ratio review

Calculate the compa-ratio for every employee: current salary divided by the midpoint of their salary band times 100. Flag employees below 80 percent as potential flight risks and employees above 120 percent as potential compression sources.

Group compa-ratio review by department

Calculate the average compa-ratio by department, job family, and grade cluster. Departments with average compa-ratios below 88 to 90 percent may have systematic underpayment that requires band updates or targeted equity adjustments rather than individual-level corrections.

Step 5: Run a Market Competitiveness Check

Matching roles to current survey data

Pull current market data for each job family using your configured survey sources and blend weights. Age the data to the current date. Compare your salary band midpoints to the market reference points for each family. Job families where your midpoints are more than 8 to 10 percent below the market reference point require band updates.

Identifying roles that are significantly below market

For roles where the band midpoint is competitive but individual employees are paid significantly below the midpoint, the issue is individual pay positioning rather than an invalid band. These employees require targeted merit or equity adjustments rather than a band change.

Step 6: Identify Pay Equity Issues

Pay equity analysis is the step that identifies whether employees in protected demographic groups are paid systematically differently from comparable peers, after controlling for legitimate factors that explain pay differences. This step must be run as part of every compensation analysis, not only in years when a specific complaint or regulatory inquiry has been received. The cost of identifying a pay equity issue proactively is a targeted equity adjustment. The cost of identifying it through a regulatory inquiry is legal fees, back pay liability, reputational damage, and potential enforcement action.

Unadjusted gap analysis

The unadjusted pay gap is the raw difference in average or median compensation between demographic groups without controlling for grade, tenure, performance, or location. Calculate the unadjusted gap for gender, race, ethnicity, and any other legally relevant dimensions across the full population. The unadjusted gap is almost always larger than the adjusted gap because it reflects both within-grade pay differences and differences in representation across grades. A large unadjusted gap combined with a small adjusted gap indicates that the pay equity problem is primarily a grade representation problem: one group is concentrated in lower grades, not paid less within grades. This is still an equity problem, but the solution is a pipeline and promotion intervention, not a salary adjustment program.

The UK Gender Pay Gap Report, EU Pay Transparency Directive, and California Civil Rights Department pay data report all require unadjusted gap disclosure. Organizations operating in these jurisdictions should produce the unadjusted gap figures as a standard analysis output, not as a reactive compliance exercise.

Adjusted gap analysis within grade clusters

The adjusted pay gap controls for legitimate factors that explain pay differences: grade, tenure band, performance rating, and geographic location. Calculate the average compa-ratio for each demographic group within each grade cluster. If one demographic group has an average compa-ratio that is 5 or more percentage points below another group in the same grade after controlling for tenure band and performance rating, you have identified a pay equity finding that requires remediation.

A full adjusted gap regression analysis using statistical controls is the gold standard and is required for regulatory purposes (OFCCP Affirmative Action Program compensation analysis, formal pay equity audit). For a preliminary screen, the grade-level compa-ratio comparison by demographic group catches most material findings without requiring a statistician. If the grade-level screen surfaces patterns that cannot be explained by tenure or performance differences, the full regression analysis should be run before the remediation plan is finalized.

When a pay equity finding requires escalation

Not every pay equity finding requires the same response. An adjusted gap below 3 percent within a grade cluster is typically within the margin of legitimate variation and can be addressed through priority merit cycle treatment for affected employees. An adjusted gap between 3 and 5 percent requires a CHRO review and a documented action plan with a specific timeline for correction. An adjusted gap above 5 percent (the EU Pay Transparency Directive's joint pay assessment threshold) requires board notification, legal counsel review, and a formal remediation program funded separately from the merit budget. Documenting which threshold each finding falls within and the corresponding escalation response is part of the pay equity step output.

Step 7: Identify Compression Issues

Pay compression is the narrowing of the salary gap between employees at different levels of experience, tenure, or seniority within the same grade or across adjacent grades. It is one of the most common causes of voluntary turnover among high-performing, longer-tenured employees because compression makes their compensation effectively equivalent to that of newer, less experienced peers who were hired at more recently elevated market rates. Compression is almost never a deliberate pay decision. It is a structural accumulation of multiple years of modest merit increases falling behind market-rate escalation and new-hire salary inflation.

What pay compression looks like in the data

The clearest compression signal in a compensation analysis is a comparison of compa-ratios by hire date cohort within a grade. Sort all employees in a grade by hire date band: 0 to 12 months, 1 to 3 years, 3 to 5 years, 5 or more years. Calculate the average compa-ratio for each cohort. If the 0 to 12-month cohort has a higher average compa-ratio than the 3 to 5-year cohort in the same grade, compression exists at a measurable level. The gap between the cohorts represents the compression magnitude: a 10-percentage-point compa-ratio gap between a new hire cohort and a 4-year-tenured cohort in the same grade means that employees with four years of experience are effectively paid 10 percent less relative to the band than people hired last year.

Tenure-based compression vs. new-hire compression

Two distinct compression patterns require different remediation approaches. Tenure-based compression occurs when long-tenured employees have received consistently below-market merit increases over multiple years, leaving their compa-ratios behind despite their accumulated experience and performance. The remedy is a targeted equity adjustment for the affected tenure cohort, funded from a market adjustment budget separate from the merit pool.

New-hire compression occurs when recruiting in a competitive market requires offering new hires at or above the band midpoint, while the incumbent employees in the same grade are clustered below the midpoint from years of gradual merit increases. The remedy is the same equity adjustment approach for tenured incumbents, but the root cause is different: the band midpoint may no longer represent the current market even if it was competitive two years ago. Identifying which type of compression is present determines whether the solution is an individual equity adjustment program, a band update, or both.

How compression compounds without intervention

Compression left unaddressed does not remain at its current level. Each merit cycle that applies a flat percentage across a compressed population widens the absolute dollar gap between tenured employees and newer hires, even if the percentage merit increase is identical. An employee earning $82,000 who receives a 3.5 percent merit increase gains $2,870. An employee in the same grade earning $107,000 who receives the same 3.5 percent gains $3,745. Identical merit percentages produce larger absolute increases for the higher-paid employee, which is typically the newer hire or the incumbent at a higher compa-ratio. After three cycles without intervention, what was a modest compression problem becomes a material retention risk for the employees the organization most needs to retain.

Step 8: Quantify the Cost of Remediation

For each category of finding (band updates, equity adjustments, compression corrections, market adjustments), calculate the annual payroll cost of bringing affected employees to the target position. This quantification is what enables Finance to approve the remediation plan as a specific budget line rather than an open-ended commitment.

Structure the cost by finding the type and priority tier. Band updates affect the midpoint calculation for all employees in the grade and therefore change the compa-ratio baseline for the entire population. Equity adjustments affect specific employees identified in the pay equity step. Compression corrections affect the identified tenure cohorts within grades. Market adjustments affect the employees whose individual salaries are below the market competitiveness threshold for their job family, regardless of their compa-ratio within the current (possibly stale) band.

Present the total remediation cost as a single number alongside the categorized breakdown. Finance needs the total to evaluate budget impact. HR needs the breakdown to understand which findings are driving the cost and to sequence the remediation in priority order if the total cost requires phasing.

Step 9: Build the Remediation Plan and Document Everything

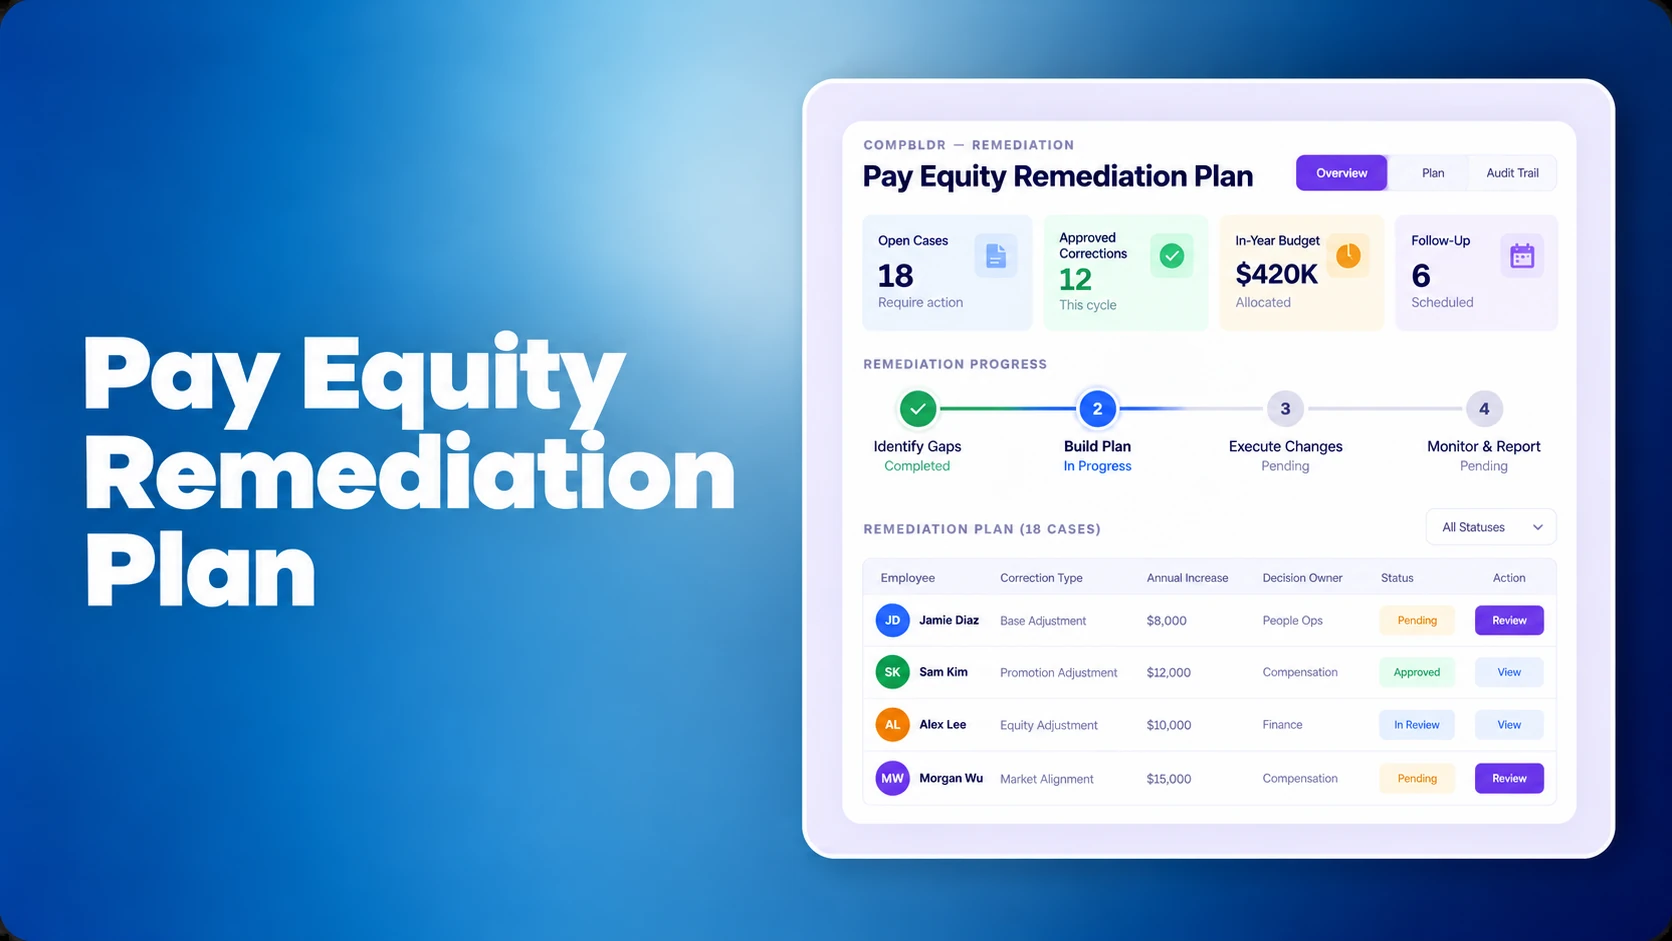
The remediation plan is the deliverable that converts a compensation analysis from a diagnostic exercise into a governance action. It specifies who receives what type of correction, on what timeline, funded from which budget, and approved through which authority chain. Without a documented remediation plan, compensation analysis findings accumulate without being acted on, the same issues surface in the next annual analysis, and the cost of remediation grows each year the action is deferred.

Structure the remediation plan in three tiers.

Tier 1: Immediate action, current cycle.

These are the highest-risk findings: employees with a compa-ratio below 85 percent and a performance rating at Meets Expectations or above, pay equity findings with an adjusted gap above 3 percent in any grade cluster, and compression cases where tenured high performers are within 5 percent compa-ratio of newly hired peers. Tier 1 actions should be implemented as off-cycle equity adjustments funded from a dedicated market adjustment budget, with a target effective date within the current quarter.

Tier 2: Next merit cycle.

These are structural corrections that require band updates or targeted merit matrix adjustments for affected populations. Band updates take effect at the start of the next merit cycle. Employees in job families with confirmed market lag receive priority merit matrix recommendations to move them toward the updated midpoint. Tier 2 findings are documented with the specific band changes required and the merit matrix adjustments that will be applied.

Tier 3: Monitor.

These are findings below the immediate action threshold that should be tracked quarterly. Employees between 86 and 90 percent compa-ratio, compression cases with a gap below 5 percentage points, and pay equity gaps below 3 percent adjusted fall into this tier. They do not require immediate budget but must be monitored to prevent migration into Tier 1 before the next formal analysis.

The documentation your remediation plan must include

Each remediation action in the plan requires four documented elements: the finding that triggered the action (specific compa-ratio, market gap percentage, or equity gap measurement), the proposed correction (target salary, target compa-ratio, or target band midpoint), the cost of the correction as an annualized payroll increase, and the approval authority required (HR Director, CHRO, Finance, or board for large-scale programs). This documentation serves three purposes: it enables the approval process to proceed without repeated clarification requests, it creates the governance record demonstrating that the finding was identified and addressed, and it provides the input that a pay equity auditor, OFCCP examiner, or pay transparency regulator would request when reviewing the organization's compensation practices.

What happens when the remediation plan is not documented

An undocumented remediation plan is not a plan; it is an intention. When the intent to correct a pay equity finding is not documented with a specific target, timeline, and approval, three things typically happen. First, the correction is delayed as budget priorities shift and the specific action items become unclear without a written reference. Second, the finding recurs in the next analysis, now with a larger gap and a higher remediation cost, without any documentation that the organization was previously aware of the issue. Third, if a regulatory inquiry arrives between the analysis and the remediation, the absence of a documented action plan is a significantly worse position than the presence of one, even if the plan has not yet been fully executed. A documented plan with partial execution demonstrates good faith. An undocumented intent with full awareness of a finding does not.

A Compensation Analysis Is Only as Good as the Data It Starts With

Compensation analyses that run from spreadsheets take weeks to set up and produce results that expire within a quarter. CompBldr gives you the governed compensation data infrastructure that makes a nine-step analysis a regular process rather than an annual fire drill. Book a Demo.

Quick Takeaways: Compensation Analysis Guide

  • Core Operational Definition: A compensation analysis is a structured, comprehensive review of an organization's internal pay architecture. It evaluates whether current employee salaries are competitive with the external market, equitable across demographic groups, and structurally consistent internally.
  • Critical Temporal Triggers: To optimize financial governance, run this analysis immediately prior to launching an annual merit cycle. It should also be triggered following a rapid hiring surge , before expanding into pay-transparency-mandated jurisdictions , or during corporate acquisition merges.
  • Compa-Ratio Risk Flags: Individual calculations serve as clear flight-risk indicators. Tag individuals tracking under 80% compa-ratio as acute attrition risks , while targeting entire departments averaging under 88% to 90% for systemic, structural band overhauls.
  • Market Aging Alignment: Defensible reviews require compiling functional data weights, aging those external salary benchmarks to the current calendar date, and updating structural ranges if baseline band midpoints lag behind market targets by more than 8% to 10%.
  • Remediation Costing Models: A successful audit translates qualitative findings into a discrete, quantified annual payroll cost metric. Isolating remediation costs into explicit budget lines empowers HR to secure rapid Finance and C-suite alignment.

What Is a Compensation Analysis?

A compensation analysis is a structured review of an organization's pay structure to determine whether salaries are competitive with the external market, equitable across employee groups, and internally consistent. It examines compa-ratios, market competitiveness by job family, pay equity across demographic groups, salary band validity, and pay compression. A complete compensation analysis produces a prioritized list of remediation actions with quantified costs, enabling HR and Finance to make data-driven decisions about where to invest compensation spend.

When You Need a Compensation Analysis

Before a merit cycle opens

Running a compensation analysis before opening the merit cycle gives HR and Finance visibility into where the budget will have the most impact: which job families are most below market, which employees have the most significant compa-ratio gaps, and where compression exists that will require equity adjustments separate from merit. Without this analysis, the merit budget is allocated based on manager advocacy rather than data.

After a period of rapid hiring

Rapid hiring, particularly in competitive talent markets where new hires are brought in at or above band midpoint, consistently creates compression for tenured employees. A compensation analysis after a hiring surge surfaces the compression before affected employees leave rather than after.

In response to pay transparency law changes

When your organization enters a new state or jurisdiction with pay transparency requirements, a compensation analysis validates that your salary ranges are grounded in documented methodology and defensible against regulatory review before you are required to post them.

Before or after an acquisition

Acquisitions bring together two organizations with different compensation structures, pay philosophies, and grade systems. A compensation analysis of both organizations is the foundation for harmonizing the two structures in a way that is equitable, defensible, and financially sustainable.

Step 1: Define the Scope and Objectives

Before pulling any data, document what the analysis is designed to answer. Is the primary objective market competitiveness, pay equity, compression identification, or a combination? The objective determines which data fields are required, which analyses to run, and what the output should look like. Undefined scope leads to analyses that answer the wrong questions.

Step 2: Gather and Clean Your Compensation Data

Required data fields

Current base salary, job grade and level, job family, demographic information (gender and ethnicity at minimum), location, tenure, most recent performance rating, and date of last salary adjustment. Benefits and equity grant data are required for a total compensation analysis.

Common data quality issues to resolve first

Employees without grade assignments should be reviewed and graded before inclusion. Part-time employees should have their salaries converted to full-time equivalent before comparison. Employees in transition (new hires in first 90 days, employees mid-promotion) may need to be excluded or handled separately. Missing demographic data should be sourced from employment records where available.

Step 3: Audit Your Salary Band Structure

A compensation analysis that calculates compa-ratios without first auditing the salary bands those compa-ratios are based on produces unreliable output. A compa-ratio of 95 percent against an outdated or incorrectly designed band may not signal competitive pay at all. Before compa-ratios are calculated, the bands themselves must be verified as current, consistent, and correctly constructed.

Are your bands anchored to current market data?

Each salary band should have a documented midpoint derived from external compensation survey data (Radford, Mercer, WTW, or equivalent), a stated pay positioning strategy (for example, P50 of the relevant market), a survey blend methodology, and a date of last update. A band midpoint that was set from 2022 survey data without aging adjustments is likely 8 to 20 percent below the current market for most professional and technical job families, depending on the pace of market movement in that function. Bands in fast-moving segments such as AI engineering, machine learning, clinical nursing, and cybersecurity are the highest risk of being materially stale.

The audit step compares each band's current midpoint to the current market reference point (survey P50 aged to the current date) for the relevant job family. A midpoint more than 8 to 10 percent below the current P50 is a candidate for a band update before the compa-ratio analysis runs, because running the compa-ratio against a stale midpoint will systematically understate the true market gap for employees in that family.

Are bands consistently applied across equivalent roles?

The second audit dimension is internal consistency. Roles that perform equivalent work at equivalent scope and accountability levels should be in the same grade and therefore governed by the same salary band. If two Senior Engineers in different departments are in different grades because their managers made independent leveling decisions without a formal job evaluation methodology, the compa-ratio comparison between them will be meaningless: the employee in the higher grade will show a lower compa-ratio not because they are paid less but because their grade band has a higher midpoint.

This audit requires reviewing grade assignments for roles that share a title or similar scope description across departments, flagging grade inconsistencies for resolution before the analysis proceeds, and documenting the evaluation methodology used to assign or confirm grades. For organizations using CompBldr's JESAP framework, every grade assignment has a documented factor score that makes this audit straightforward: if two Senior Engineers have different grades, the factor scores explain exactly why, and the explanation either holds under review or it does not.

What to do when a band fails the audit

Two outcomes require action before the analysis continues. First, if a band midpoint is confirmed to be more than 10 percent below the current market reference, the band should be updated before compa-ratios are calculated. This prevents the analysis from producing remediation recommendations calibrated to a stale target that will need to be revised again after the band update. Second, if grade assignments for equivalent roles are found to be inconsistent, those assignments should be resolved through a documented evaluation before the analysis proceeds. Including employees with incorrectly assigned grades in a compa-ratio analysis produces findings that misidentify the root cause: a compensation problem looks like a grading problem, or a grading problem looks like a compression finding.

Step 4: Calculate Compa-Ratios Across the Organization

Individual compa-ratio review

Calculate the compa-ratio for every employee: current salary divided by the midpoint of their salary band times 100. Flag employees below 80 percent as potential flight risks and employees above 120 percent as potential compression sources.

Group compa-ratio review by department

Calculate the average compa-ratio by department, job family, and grade cluster. Departments with average compa-ratios below 88 to 90 percent may have systematic underpayment that requires band updates or targeted equity adjustments rather than individual-level corrections.

Step 5: Run a Market Competitiveness Check

Matching roles to current survey data

Pull current market data for each job family using your configured survey sources and blend weights. Age the data to the current date. Compare your salary band midpoints to the market reference points for each family. Job families where your midpoints are more than 8 to 10 percent below the market reference point require band updates.

Identifying roles that are significantly below market

For roles where the band midpoint is competitive but individual employees are paid significantly below the midpoint, the issue is individual pay positioning rather than an invalid band. These employees require targeted merit or equity adjustments rather than a band change.

Step 6: Identify Pay Equity Issues

Pay equity analysis is the step that identifies whether employees in protected demographic groups are paid systematically differently from comparable peers, after controlling for legitimate factors that explain pay differences. This step must be run as part of every compensation analysis, not only in years when a specific complaint or regulatory inquiry has been received. The cost of identifying a pay equity issue proactively is a targeted equity adjustment. The cost of identifying it through a regulatory inquiry is legal fees, back pay liability, reputational damage, and potential enforcement action.

Unadjusted gap analysis

The unadjusted pay gap is the raw difference in average or median compensation between demographic groups without controlling for grade, tenure, performance, or location. Calculate the unadjusted gap for gender, race, ethnicity, and any other legally relevant dimensions across the full population. The unadjusted gap is almost always larger than the adjusted gap because it reflects both within-grade pay differences and differences in representation across grades. A large unadjusted gap combined with a small adjusted gap indicates that the pay equity problem is primarily a grade representation problem: one group is concentrated in lower grades, not paid less within grades. This is still an equity problem, but the solution is a pipeline and promotion intervention, not a salary adjustment program.

The UK Gender Pay Gap Report, EU Pay Transparency Directive, and California Civil Rights Department pay data report all require unadjusted gap disclosure. Organizations operating in these jurisdictions should produce the unadjusted gap figures as a standard analysis output, not as a reactive compliance exercise.

Adjusted gap analysis within grade clusters

The adjusted pay gap controls for legitimate factors that explain pay differences: grade, tenure band, performance rating, and geographic location. Calculate the average compa-ratio for each demographic group within each grade cluster. If one demographic group has an average compa-ratio that is 5 or more percentage points below another group in the same grade after controlling for tenure band and performance rating, you have identified a pay equity finding that requires remediation.

A full adjusted gap regression analysis using statistical controls is the gold standard and is required for regulatory purposes (OFCCP Affirmative Action Program compensation analysis, formal pay equity audit). For a preliminary screen, the grade-level compa-ratio comparison by demographic group catches most material findings without requiring a statistician. If the grade-level screen surfaces patterns that cannot be explained by tenure or performance differences, the full regression analysis should be run before the remediation plan is finalized.

When a pay equity finding requires escalation

Not every pay equity finding requires the same response. An adjusted gap below 3 percent within a grade cluster is typically within the margin of legitimate variation and can be addressed through priority merit cycle treatment for affected employees. An adjusted gap between 3 and 5 percent requires a CHRO review and a documented action plan with a specific timeline for correction. An adjusted gap above 5 percent (the EU Pay Transparency Directive's joint pay assessment threshold) requires board notification, legal counsel review, and a formal remediation program funded separately from the merit budget. Documenting which threshold each finding falls within and the corresponding escalation response is part of the pay equity step output.

Step 7: Identify Compression Issues

Pay compression is the narrowing of the salary gap between employees at different levels of experience, tenure, or seniority within the same grade or across adjacent grades. It is one of the most common causes of voluntary turnover among high-performing, longer-tenured employees because compression makes their compensation effectively equivalent to that of newer, less experienced peers who were hired at more recently elevated market rates. Compression is almost never a deliberate pay decision. It is a structural accumulation of multiple years of modest merit increases falling behind market-rate escalation and new-hire salary inflation.

What pay compression looks like in the data

The clearest compression signal in a compensation analysis is a comparison of compa-ratios by hire date cohort within a grade. Sort all employees in a grade by hire date band: 0 to 12 months, 1 to 3 years, 3 to 5 years, 5 or more years. Calculate the average compa-ratio for each cohort. If the 0 to 12-month cohort has a higher average compa-ratio than the 3 to 5-year cohort in the same grade, compression exists at a measurable level. The gap between the cohorts represents the compression magnitude: a 10-percentage-point compa-ratio gap between a new hire cohort and a 4-year-tenured cohort in the same grade means that employees with four years of experience are effectively paid 10 percent less relative to the band than people hired last year.

Tenure-based compression vs. new-hire compression

Two distinct compression patterns require different remediation approaches. Tenure-based compression occurs when long-tenured employees have received consistently below-market merit increases over multiple years, leaving their compa-ratios behind despite their accumulated experience and performance. The remedy is a targeted equity adjustment for the affected tenure cohort, funded from a market adjustment budget separate from the merit pool.

New-hire compression occurs when recruiting in a competitive market requires offering new hires at or above the band midpoint, while the incumbent employees in the same grade are clustered below the midpoint from years of gradual merit increases. The remedy is the same equity adjustment approach for tenured incumbents, but the root cause is different: the band midpoint may no longer represent the current market even if it was competitive two years ago. Identifying which type of compression is present determines whether the solution is an individual equity adjustment program, a band update, or both.

How compression compounds without intervention

Compression left unaddressed does not remain at its current level. Each merit cycle that applies a flat percentage across a compressed population widens the absolute dollar gap between tenured employees and newer hires, even if the percentage merit increase is identical. An employee earning $82,000 who receives a 3.5 percent merit increase gains $2,870. An employee in the same grade earning $107,000 who receives the same 3.5 percent gains $3,745. Identical merit percentages produce larger absolute increases for the higher-paid employee, which is typically the newer hire or the incumbent at a higher compa-ratio. After three cycles without intervention, what was a modest compression problem becomes a material retention risk for the employees the organization most needs to retain.

Step 8: Quantify the Cost of Remediation

For each category of finding (band updates, equity adjustments, compression corrections, market adjustments), calculate the annual payroll cost of bringing affected employees to the target position. This quantification is what enables Finance to approve the remediation plan as a specific budget line rather than an open-ended commitment.

Structure the cost by finding the type and priority tier. Band updates affect the midpoint calculation for all employees in the grade and therefore change the compa-ratio baseline for the entire population. Equity adjustments affect specific employees identified in the pay equity step. Compression corrections affect the identified tenure cohorts within grades. Market adjustments affect the employees whose individual salaries are below the market competitiveness threshold for their job family, regardless of their compa-ratio within the current (possibly stale) band.

Present the total remediation cost as a single number alongside the categorized breakdown. Finance needs the total to evaluate budget impact. HR needs the breakdown to understand which findings are driving the cost and to sequence the remediation in priority order if the total cost requires phasing.

Step 9: Build the Remediation Plan and Document Everything

The remediation plan is the deliverable that converts a compensation analysis from a diagnostic exercise into a governance action. It specifies who receives what type of correction, on what timeline, funded from which budget, and approved through which authority chain. Without a documented remediation plan, compensation analysis findings accumulate without being acted on, the same issues surface in the next annual analysis, and the cost of remediation grows each year the action is deferred.

Structure the remediation plan in three tiers.

Tier 1: Immediate action, current cycle.

These are the highest-risk findings: employees with a compa-ratio below 85 percent and a performance rating at Meets Expectations or above, pay equity findings with an adjusted gap above 3 percent in any grade cluster, and compression cases where tenured high performers are within 5 percent compa-ratio of newly hired peers. Tier 1 actions should be implemented as off-cycle equity adjustments funded from a dedicated market adjustment budget, with a target effective date within the current quarter.

Tier 2: Next merit cycle.

These are structural corrections that require band updates or targeted merit matrix adjustments for affected populations. Band updates take effect at the start of the next merit cycle. Employees in job families with confirmed market lag receive priority merit matrix recommendations to move them toward the updated midpoint. Tier 2 findings are documented with the specific band changes required and the merit matrix adjustments that will be applied.

Tier 3: Monitor.

These are findings below the immediate action threshold that should be tracked quarterly. Employees between 86 and 90 percent compa-ratio, compression cases with a gap below 5 percentage points, and pay equity gaps below 3 percent adjusted fall into this tier. They do not require immediate budget but must be monitored to prevent migration into Tier 1 before the next formal analysis.

The documentation your remediation plan must include

Each remediation action in the plan requires four documented elements: the finding that triggered the action (specific compa-ratio, market gap percentage, or equity gap measurement), the proposed correction (target salary, target compa-ratio, or target band midpoint), the cost of the correction as an annualized payroll increase, and the approval authority required (HR Director, CHRO, Finance, or board for large-scale programs). This documentation serves three purposes: it enables the approval process to proceed without repeated clarification requests, it creates the governance record demonstrating that the finding was identified and addressed, and it provides the input that a pay equity auditor, OFCCP examiner, or pay transparency regulator would request when reviewing the organization's compensation practices.

What happens when the remediation plan is not documented

An undocumented remediation plan is not a plan; it is an intention. When the intent to correct a pay equity finding is not documented with a specific target, timeline, and approval, three things typically happen. First, the correction is delayed as budget priorities shift and the specific action items become unclear without a written reference. Second, the finding recurs in the next analysis, now with a larger gap and a higher remediation cost, without any documentation that the organization was previously aware of the issue. Third, if a regulatory inquiry arrives between the analysis and the remediation, the absence of a documented action plan is a significantly worse position than the presence of one, even if the plan has not yet been fully executed. A documented plan with partial execution demonstrates good faith. An undocumented intent with full awareness of a finding does not.

A Compensation Analysis Is Only as Good as the Data It Starts With

Compensation analyses that run from spreadsheets take weeks to set up and produce results that expire within a quarter. CompBldr gives you the governed compensation data infrastructure that makes a nine-step analysis a regular process rather than an annual fire drill. Book a Demo.
Frequently Asked Questions