

.svg)





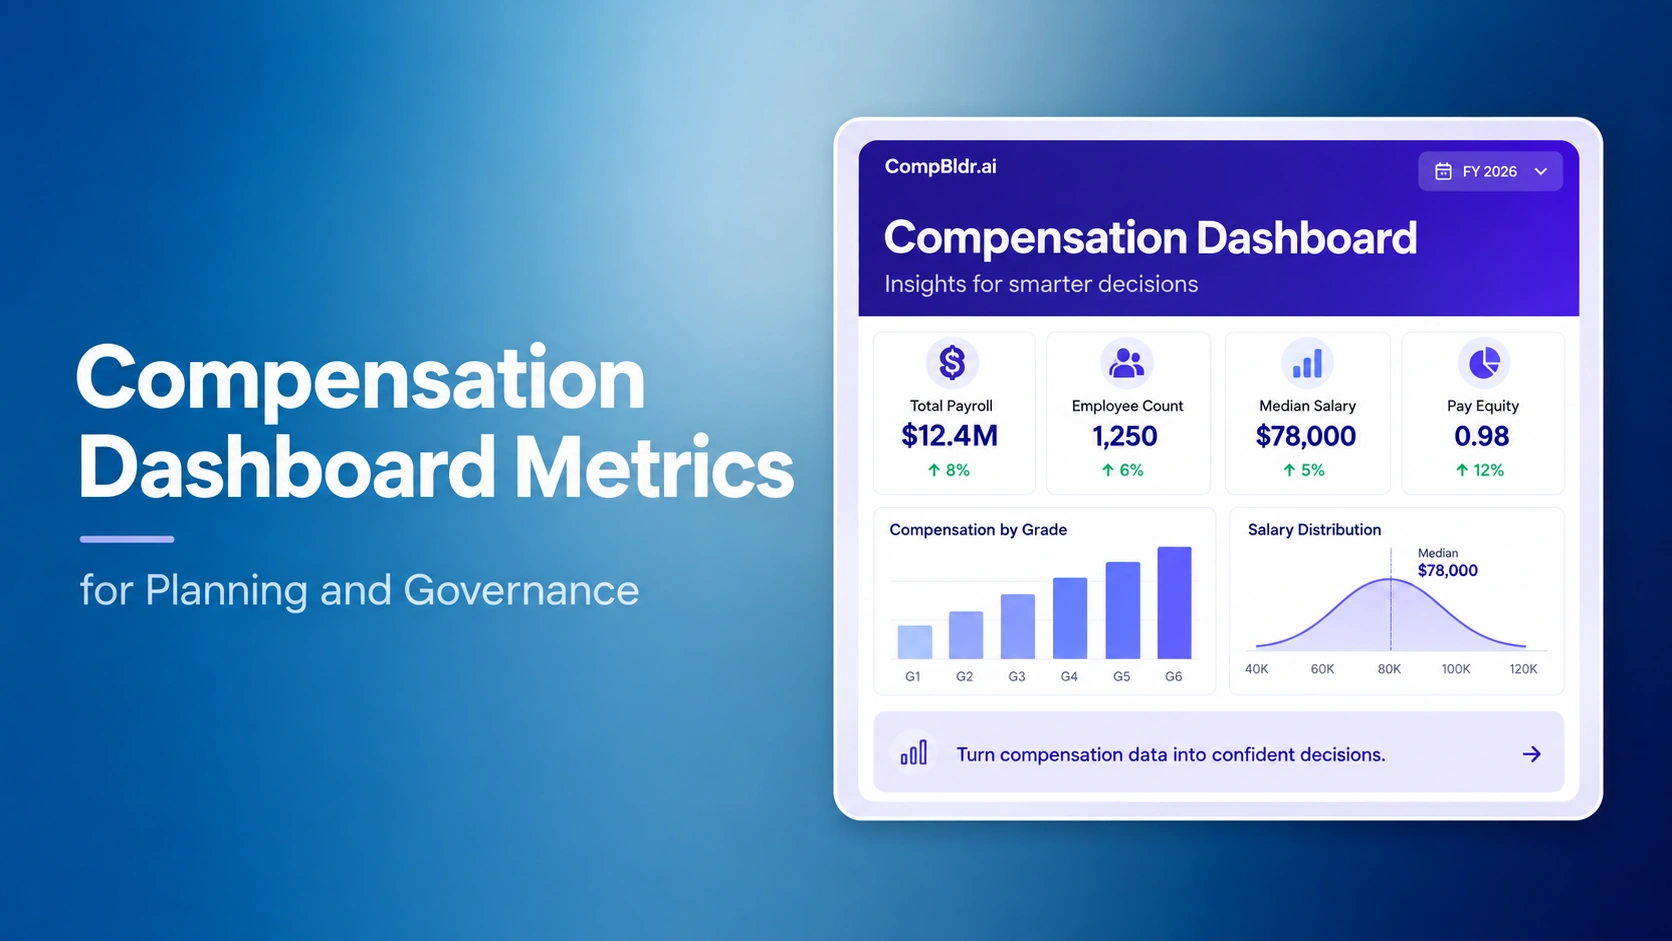

A compensation dashboard is useful only when someone knows what decision each metric is supposed to support. A chart that shows compa-ratio, budget use, market position, and pay-equity differences may look complete, but it is not a governance system unless HR and Finance also know who owns the metric, what population it covers, what should trigger review, and what evidence must be checked before action is taken.
That distinction matters during compensation planning. A budget variance can require immediate intervention. A low compa-ratio may require investigation but no immediate pay action. A pay-equity signal may require a structured analysis before anyone draws a conclusion. A stale benchmark date may mean the dashboard itself is not fit for the decision being made.
This guide is about using compensation dashboard metrics for planning and governance. It is intentionally different from CompBldr's broader Compensation Analytics Dashboard: 8 Metrics for CHROs and Finance Teams, which covers the executive metric set. Here, the focus is the operating discipline behind the dashboard: signal, review, decision, owner, and evidence.
What the Dashboard Should Do
A compensation dashboard should answer three different kinds of questions:
- Planning control: Is the active cycle progressing inside the approved budget, policy, and approval structure?
- Governance review: Are there range, market, equity, or exception patterns that deserve investigation?
- Outcome review: Did the completed decisions produce the distribution, cost, and structural effects the organization intended?
Mixing these three jobs without labeling them creates confusion. A live planning control may change hourly as managers submit proposals. A market-position metric may be valid only as of the most recent benchmark refresh. A finalized board report should preserve the approved period and definitions rather than continue changing after review.
That is why CompBldr separates live Compensation Analytics from finalized Compensation Reporting. Dashboards support active decisions; reports preserve a fixed record for review and communication.
The Metric Control Matrix
The most useful dashboard design starts with the decision, not the visualization.
Separate Planning From Governance
Planning controls answer questions that may require intervention before a cycle closes. Governance metrics identify patterns that need interpretation. The same dashboard can contain both, but they should not be treated with the same urgency.
For example, if a department has used 98% of its approved merit budget while 30% of eligible employees are still unsubmitted, that is an operational planning problem. HR and Finance need to inspect pending proposals before final approvals continue.
By contrast, if one job family has a lower average compa-ratio than another, the dashboard has identified a comparison. It has not established that the first family is underpaid. The team still needs to inspect job levels, range design, employee distribution, market strategy, geography, tenure or experience patterns, and other relevant context.
This signal-versus-verdict distinction is central to good compensation analytics.
Budget and Forecast Controls
During an active compensation planning cycle, Finance needs more than a single percentage labeled “budget used.” The useful view separates at least four states:
- Approved budget: the amount authorized for the defined population or business unit
- Proposed spend: manager recommendations currently in the workflow
- Approved spend: proposals that have completed the required approval stage
- Remaining or forecast spend: the amount still available or the expected close position based on the current cycle state
Those states matter because proposed and approved spend are not interchangeable. A dashboard that combines them can make a cycle look more committed than it really is or hide future pressure sitting in unsubmitted populations.
Segment budget metrics by the organizational level that actually owns the decision: division, department, cost center, manager, or another configured planning unit. CompBldr's current planning workflow supports budget visibility as proposals move through the cycle, allowing HR and Finance to review the same planning record rather than reconcile separate files. See the related guide on real-time merit budget control.
Cycle Progress and Approvals
A budget can be on plan while the cycle itself is in trouble. That is why planning dashboards also need process metrics.
Useful operational measures include the percentage of eligible employees reviewed, manager worksheets not started, proposals submitted, records returned for correction, approvals pending, and the age of items in each approval stage.
The purpose is not to rank managers publicly. It is to identify bottlenecks early enough to fix them. Ten late worksheets concentrated under one executive may require a different intervention than ten late worksheets scattered across ten first-time managers.
Exceptions Need a Denominator
“42 exceptions” is not a useful governance metric without context. Forty-two exceptions across 8,000 employee decisions is different from 42 across 120.
Track both exception count and exception rate, with a denominator that matches the decision being reviewed. Useful cuts can include manager, business unit, grade, pay action, approval threshold, and policy rule.
Also distinguish types of exceptions. A promotion processed through its approved workflow should not be mixed with an unexplained merit override. A market adjustment, retention action, salary-range exception, and out-of-guideline merit proposal have different evidence and approval requirements.
A strong dashboard lets the analyst move from the aggregate count to the underlying rationale and approval record. Otherwise the metric creates heat without explaining the cause.
Range Position Is a Signal
Compa-ratio and range penetration are useful because they show where employee pay sits relative to an approved salary structure. They should not be used as automatic correction rules.
A compa-ratio below 1.00 means base salary is below the applicable range midpoint. It does not, by itself, prove underpayment. Likewise, an employee above midpoint is not automatically overpaid. Interpretation depends on the organization's range design, job level, experience, performance, location, market strategy, pay history, and other documented factors.
The dashboard should therefore emphasize distribution and concentration. If below-minimum employees cluster in one acquired business unit, or above-maximum employees cluster in one aging salary structure, that pattern is more actionable than a company-wide average.
Out-of-range records should drill into the governing salary range, job architecture, effective date, and prior pay action before a correction is recommended.
Market Position Needs Lineage
“Engineering is 8% below market” sounds precise, but it is meaningless unless the dashboard can answer: Which jobs? Which survey source? Which reference market? Which percentile? Which effective date? Were values aged? Were the job matches approved?
A market metric should preserve that lineage. The organization may intentionally lead, match, or lag a selected labor market, and different job families may use different relevant sources or geographic cuts.
This is why the dashboard should connect market-position views to the governed Market Benchmarking process and the underlying distinction between benchmarking and market pricing.
In CompBldr, market-position metrics can be traced back to the benchmarking records that support them, including the relevant survey sources, aging assumptions, and configured market strategy.
Pay Equity Needs Analysis
A compensation dashboard can surface pay-position differences, outliers, or patterns across defined employee groups. It should not present a visual difference as proof of inequity or discrimination.
Before escalation, confirm the population, job comparability, data completeness, pay definition, time period, and relevant explanatory factors. Statistical methods and legal review requirements will depend on the organization's purpose, jurisdiction, data, and analysis design.
The dashboard's role is to create a governed review queue. A formal pay equity analysis should preserve methodology, assumptions, population definitions, findings, and any resulting actions separately from a high-level visual signal.
This is also where analyst access matters. Executive users may need a trend or issue count. Compensation analysts need the cohort definition and drill-through evidence behind the signal.
Data Quality Belongs Beside Metrics
A dashboard that hides source quality can be more dangerous than a spreadsheet because the visual polish encourages confidence.
For each important metric, expose enough metadata to answer:
- When was the source refreshed?
- What employee or job population is included?
- Which records are missing a grade, range, market match, performance input, or manager assignment?
- Which source system owns the underlying field?
- Has the metric been reconciled to the approved planning or benchmarking record?
Coverage should be visible as a denominator where possible. “94% of active employees mapped to an approved salary range” is more decision-useful than a range-position chart that silently excludes the other 6%.
CompBldr Analytics ties dashboard metrics back to governed planning, benchmarking, evaluation, or pay-action records so analysts can investigate the source behind a number rather than treating the visualization as the final evidence.
Illustrative Governance Review
Illustrative example: A 900-employee organization is halfway through its annual merit cycle. About 60% of eligible employees have manager proposals. The executive summary shows the overall budget is still on plan.
An analyst drills into four signals:
- The Product organization has committed a larger share of its budget than its completion rate would suggest.
- One sales manager has a materially higher override rate than peer managers.
- A technical job family shows a cluster of employees close to or above range maximum.
- A pay-position comparison across one employee cohort shows a difference large enough to warrant review.
None of those four signals should produce the same response.
Budget signal: Finance and Compensation inspect unsubmitted employees, pending promotions, manager proposals, and whether budget transfers are permitted before approving more spend.
Override signal: Compensation reviews the manager's rationales. If the exceptions are tied to approved promotions or market actions, the pattern may be legitimate. If they are undocumented merit overrides, the manager may need intervention.
Range signal: The team checks whether the technical range is current, whether employees were leveled correctly, whether the range maximum is intentionally binding, and whether recent structural changes explain the concentration.
Equity signal: The team verifies comparability and data quality, then routes the issue into the organization's defined pay-equity review method rather than attempting to solve it from the chart.
The dashboard creates value because it tells the team where to look next. Governance creates value because it determines what evidence is sufficient to act.
Review Cadence by Decision
There is no universal review cadence for every compensation metric. Frequency should match how quickly the underlying decision can change.
When a metric needs to become a permanent record, move it from the live dashboard into a versioned reporting process. Live analytics and fixed report packages serve different governance purposes.
Who Should See What
Not every stakeholder needs the same dashboard depth.
- CHRO and senior HR leadership: organization-level budget, market, equity, range, and major exception trends.
- Finance: approved budget, proposed and approved spend, forecast-to-close, cost-center or department variance, and off-cycle impact.
- Compensation analysts: detailed distributions, cohort filters, data-quality indicators, market lineage, exception drill-through, and source records.
- HR Operations: cycle completion, approval queues, missing data, manager access, and workflow exceptions.
- Managers: only the employee, budget, recommendation, and status information authorized for their own planning responsibility.
CompBldr's analytics views are designed around different stakeholder needs while reading from the same governed compensation data. Within the planning workflow, manager access can be scoped to the employees and decisions relevant to that manager.
What Metrics Cannot Prove
A high-quality compensation dashboard should make its limitations obvious.
- A low compa-ratio does not prove an employee is underpaid.
- An above-maximum salary does not automatically mean the employee's pay should be reduced.
- A demographic pay difference does not, by itself, establish unlawful discrimination.
- A team over budget does not prove the manager made poor decisions.
- A market-position gap does not prove the salary structure is wrong until the source, match, date, and strategy are checked.
- A high exception rate does not prove policy failure if the population contains legitimate promotions, acquisitions, restructures, or market actions.
These are review signals. A governed compensation process preserves the next layer of evidence needed to determine what they mean.
Build for Drill-Through
The practical test of a compensation dashboard is not whether an executive can see the chart. It is whether an analyst can answer the follow-up question without rebuilding the metric in Excel.
For any material number, the dashboard should make it possible to trace back to the relevant population and source decision. A budget variance should lead to proposals and approvals. A market-position shift should lead to benchmark records. A range exception should lead to the job, grade, range, effective date, and pay-action history.
That drill-through requirement is what turns a dashboard from a presentation layer into a working compensation-control surface.
How CompBldr Connects the View
CompBldr Analytics organizes live compensation analysis around pay equity, budget, market position, and active merit-cycle monitoring. The important distinction is not the number of charts. Metrics read from governed planning, benchmarking, evaluation, and pay-action records so users can trace a dashboard signal back to the source process that produced it.
For active cycles, the Compensation Planning workflow connects eligibility, manager proposals, budgets, approvals, and decision history. For fixed deliverables, Compensation Reporting produces versioned report packages rather than continuing to change with the live dashboard.
The architecture is deliberate: use analytics to identify and investigate what is happening; use the governed source record to understand why; use reporting when the organization needs a finalized record of what was approved.

.webp)

.svg)

.svg)
.svg)

