

.svg)





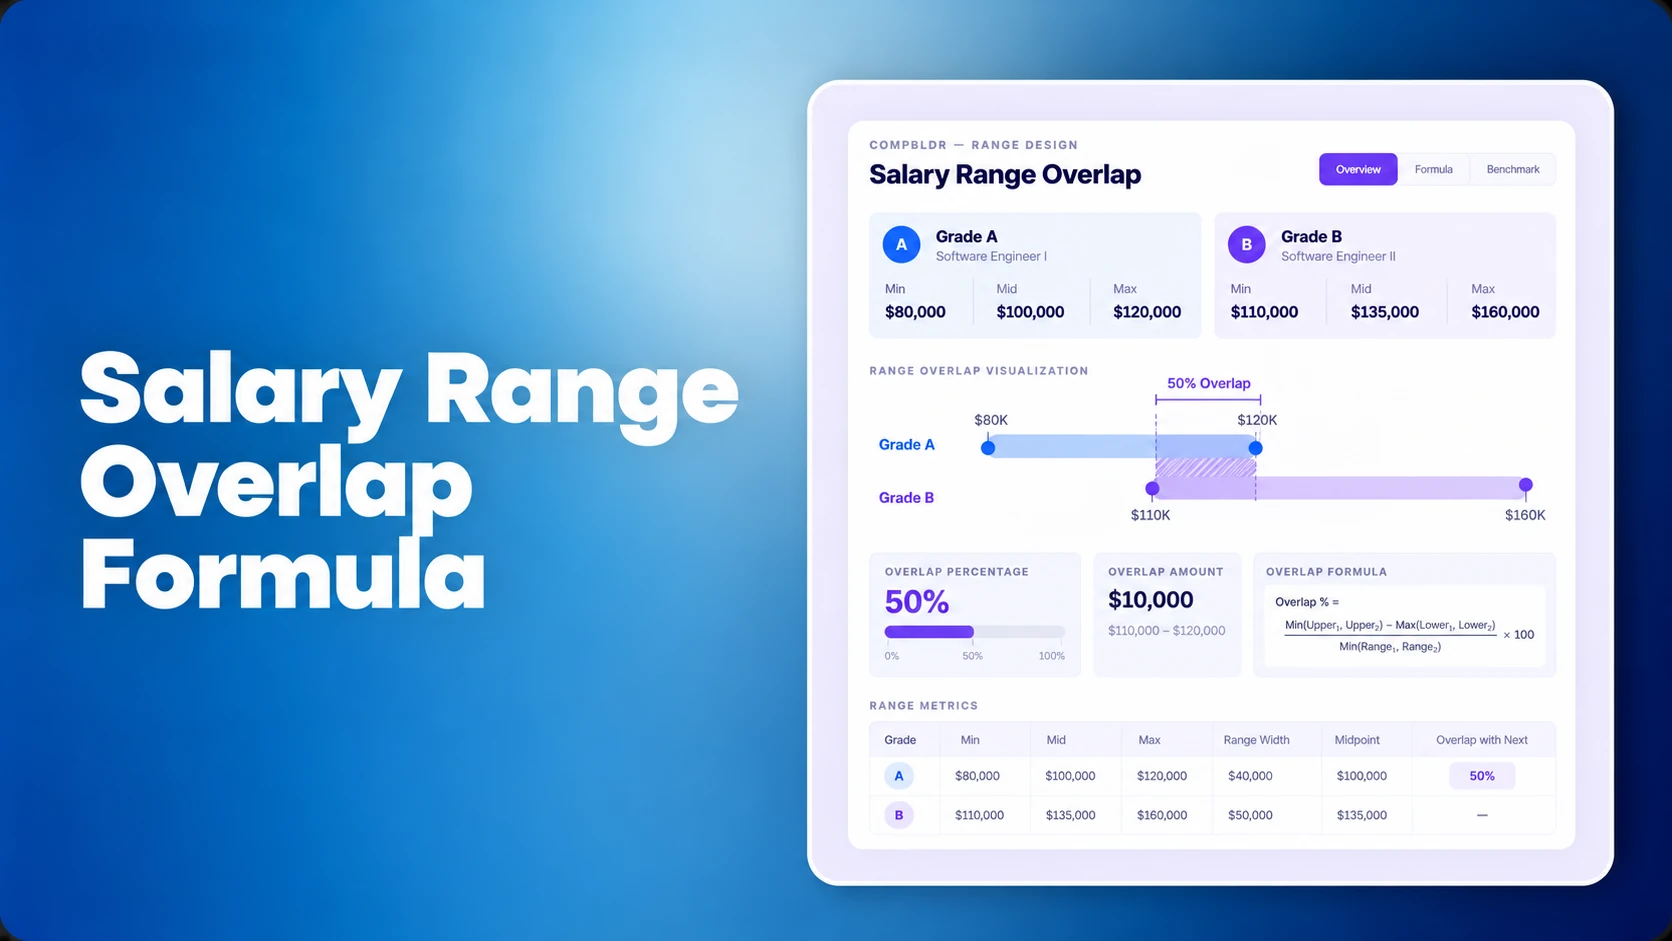

A manager wants to promote an analyst from Grade 5 to Grade 6. The employee earns $85,000. Grade 5 runs from $60,000 to $90,000, and Grade 6 runs from $75,000 to $112,500. Both grades can legitimately contain the employee's current salary. The manager asks a fair question: if the promotion changes the employee's responsibilities, why does the new grade start below what the employee already earns?
That is where a salary range overlap formula helps. It measures the shared salary territory between adjacent grades and makes the structure's trade-offs visible. The overlap percentage does not determine whether a promotion requires a particular increase, whether two jobs are equal, or whether a pay gap is unlawful.
This article concentrates on calculating and interpreting salary range overlap between grades. It does not repeat the general salary range definition, the approach to building salary bands, or the separate discussion of how wide each salary range should be. Those articles govern the individual band. Here the decision is how one band intersects with the next.
What Is Salary Range Overlap?
Salary range overlap is the dollar interval shared by two adjacent pay grades. Suppose Grade 5 spans $60,000 to $90,000 and Grade 6 spans $75,000 to $112,500. Employees earning between $75,000 and $90,000 sit within both ranges, even though their jobs may carry different responsibility levels.
That shared portion is $15,000. The percentage depends on which grade's total width is used as the denominator. The calculation belongs to salary-structure design, not employee-specific compa-ratio or range penetration. Those latter metrics locate an individual salary within one band.
Salary Range Overlap Formula: Two Valid Denominators
The salary band overlap formula must name its denominator. In compensation practice, pay grade overlap can be reported using the upper grade's range width or the lower grade's range width. Both measure the same shared dollars but answer different questions. ERI's compensation formulas reference defines the upper-grade denominator, while Salary.com's formula guidance presents a lower-grade denominator. Some other calculators also use the lower-grade method. Label the method on every report rather than presenting an unexplained percentage.
Method A: Shared dollars as a percentage of the higher grade
Upper-grade overlap % = (lower-grade maximum − higher-grade minimum) ÷ (higher-grade maximum − higher-grade minimum) × 100. This is the ERI-style measure for conventional ascending adjacent ranges when the intervals intersect. It answers: what share of the higher grade is already accessible within the lower grade?
Method B: Shared dollars as a percentage of the lower grade
Lower-grade overlap % = (lower-grade maximum − higher-grade minimum) ÷ (lower-grade maximum − lower-grade minimum) × 100. This answers: what share of the lower grade's salary territory is also included in the next grade?
| Input or result | Grade 5 / lower range | Grade 6 / higher range |
|---|---|---|
| Minimum salary | $60,000 | $75,000 |
| Maximum salary | $90,000 | $112,500 |
| Range width | $30,000 | $37,500 |
| Shared salary interval | $75,000 to $90,000 | $15,000 shared |
| Upper-grade method | $15,000 ÷ $37,500 | 40.0% overlap |
| Lower-grade method | $15,000 ÷ $30,000 | 50.0% overlap |
The numbers are not contradictory. Both methods use $15,000 of actual shared salary coverage, but the higher grade has a $37,500 width while the lower grade has a $30,000 width. Write “40% of the higher range” or “50% of the lower range” in the report. Calling either one simply “40% overlap” or “50% overlap” invites avoidable disagreement.
A useful pay range overlap calculation must also identify the underlying salary data: grade ID, effective date, geography, currency, pay basis, and the version of the approved salary structure. Compare annual base salary to annual base salary; do not combine annual and hourly amounts or mix different location policies without normalizing them.
Calculate the Overlap When Two Ranges Have Different Widths
If the upper grade begins at or above the lower grade's maximum, the grades do not overlap; a positive salary gap may exist. If the bands are identical, the overlap is 100% of either grade. More unusual nested or nonascending bands need an intersection formula rather than the simple adjacent-grade expression.
Shared dollars = max(0, min(lower maximum, upper maximum) − max(lower minimum, upper minimum)). Then divide by the chosen grade's width. This generalized formula handles a fully nested range as well as ordinary partially overlapping intervals, assuming each minimum is below its maximum. A touching boundary contributes zero dollars of shared interval.
| Lower grade | Higher grade | Shared dollars | As % of higher width | As % of lower width |
|---|---|---|---|---|
| $60,000–$90,000 | $75,000–$112,500 | $15,000 | 40.0% | 50.0% |
| $60,000–$90,000 | $80,000–$120,000 | $10,000 | 25.0% | 33.3% |
| $60,000–$80,000 | $85,000–$110,000 | $0 (gap $5,000) | 0.0% | 0.0% |
| $60,000–$90,000 | $60,000–$90,000 | $30,000 | 100.0% | 100.0% |
The third row has a $5,000 gap, not a negative overlap. Do not convert a negative result from the simplified equation into a negative overlap percentage. A structure with a gap can be intentional in a step-based pay system, but it may leave employees between authorized bands. That is a design and policy question, not a mathematical error.
Salary Grade Overlap Example: Review a Three-Grade Structure
Single-pair calculations do not tell Compensation whether the entire grade architecture behaves consistently. Start with a consecutive set of ranges from the same approved structure and compare one grade with the next. Here is a deliberately simple salary grade overlap example with two different degrees of overlap.
| Pay grade | Minimum | Midpoint | Maximum | Overlap with next grade, higher-width basis |
|---|---|---|---|---|
| Grade 5 | $60,000 | $75,000 | $90,000 | 40.0% (with Grade 6) |
| Grade 6 | $75,000 | $93,750 | $112,500 | 36.8% (with Grade 7) |
| Grade 7 | $95,000 | $118,750 | $142,500 | Not applicable |
Between Grades 6 and 7, shared dollars equal $112,500 − $95,000 = $17,500. Grade 7 is $47,500 wide, so the upper-grade percentage is $17,500 ÷ $47,500 = 36.8% (rounded). That differs from the previous pair's 40.0%. This is not automatically a defect: Grade 7 has a different midpoint progression and grade width.
To make the comparison useful, look at the specific roles assigned through job architecture and validated with job evaluation. A grade associated with materially broader accountabilities may warrant a different structure from an entry-level progression. If a disputed grade assignment rather than the salary bands is driving the problem, review the difference between job grades and levels before changing the structure.
Keep Pay Grade Ranges Connected to Job Architecture
See how CompBldr links governed grades, market evidence, salary ranges and employee pay positions so compensation teams can review structure changes in context.
Why Range Spread and Midpoint Progression Change Overlap
Managers often ask Compensation to “reduce salary band overlap” as if overlap were an independent slider. It generally is not. Two decisions drive the result: range spread (maximum relative to minimum) and midpoint progression (the movement between adjacent midpoints).
For conventional grades with the same spread defined as (maximum − minimum) ÷ minimum, and with midpoints at the arithmetic center of the bands, the percentage measured against the lower grade's width simplifies to 1 − (midpoint progression ÷ range spread), provided the resulting ranges overlap. This shortcut is not the ERI-style higher-grade percentage; changing the denominator changes the calculation.
In the first worked pair, range spread is ($90,000 − $60,000) ÷ $60,000 = 50%. Grade midpoint progression is ($93,750 − $75,000) ÷ $75,000 = 25%. The lower-grade shortcut gives 1 − (25% ÷ 50%) = 50%; the higher-grade calculation remains 40%.
The shortcut is unreliable when adjacent grades have different spreads, nonstandard midpoint definitions or unusual nested intervals. In those cases use the actual interval endpoints. For a deeper look at band design, refer to salary range spread by job level and the salary-band construction process.
What Is Too Much Salary Band Overlap?
There is no universally correct percentage. Some compensation references describe roughly 50–60% higher-grade overlap as moderate for a conventional structure, but that is a design illustration, not a required standard. The right decision depends on grade count, the spread policy, midpoint progression, actual market rates, employee progression practices and the nature of the jobs.
The more useful questions are operational: can managers explain why a role moved grades when the salary did not change materially? Does a broad overlap create large discretion without clear position-in-range criteria? Are adjacent grades artificially separated despite similar market rates? Do the grade boundaries reflect market benchmarking and the organization's compensation philosophy?
| Observed pattern | Potential explanation | Review before acting |
|---|---|---|
| Very high overlap between many adjacent grades | Small midpoint progression relative to spread | Grade count, real differences in job value, promotion policy |
| Little or no overlap | Steep midpoint progression or narrow ranges | Hiring flexibility, promotion transitions, market evidence |
| Abrupt change in overlap between two pairs | A different range width, midpoint jump or policy version | Grade effective dates, location, source data |
| Overlap looks normal but employees cluster near maximum | Long tenure or constrained salary progression | Range penetration, compa-ratio, merit rules, compression |
| Managers treat overlap as proof of identical work | Salary dollars confused with job value | Job scope, JESAP® evaluation and grade assignment |
A high overlap may increase the need for consistent pay-placement decisions, but cannot by itself establish pay compression or a pay equity violation. Those require employee-level evidence. Use relevant pay equity review tools with appropriate comparators instead of interpreting band geometry as a conclusion about people.
How Overlap Affects Promotions and Salary Positioning
Return to the Grade 5 employee earning $85,000. The employee is inside both the original Grade 5 and new Grade 6 ranges. Grade overlap makes this possible. It does not say that the employee should receive zero increase or a predetermined percentage.
In the current grade the $85,000 salary is 113.3% of the $75,000 midpoint. At the same salary in Grade 6 it would be 90.7% of the $93,750 midpoint. The role's compa-ratio moves because the midpoint changes, even before a salary decision is made. Compensation should independently evaluate the new responsibilities, promotion guidelines, equity context, remaining range runway and budget. Promotion increases and merit increases are separate pay actions, even if they occur in the same cycle.
Suppose the organization considers a hypothetical 5% promotional increase. The new salary is $89,250, which is still within both example bands and 95.2% of the Grade 6 midpoint. That arithmetic illustrates the decision surface; it does not endorse a 5% policy. Teams should assess internal alignment, range positioning, market evidence and any separate market adjustment before authorizing a new salary.
Build a Reliable Spreadsheet Check Before Updating Ranges
In a review workbook, put the lower grade's minimum in A2, lower maximum in B2, higher minimum in C2 and higher maximum in D2. First reject any row where a maximum is not greater than its own minimum. Then calculate actual intersection dollars instead of assuming bands always follow the standard pattern.
| Output | Excel or Google Sheets formula | How to interpret |
|---|---|---|
| Shared overlap dollars | =MAX(0,MIN(B2,D2)-MAX(A2,C2)) | True shared interval, including nested cases |
| Upper-grade overlap % | =IF(OR(B2<=A2,D2<=C2),"Check ranges",MAX(0,MIN(B2,D2)-MAX(A2,C2))/(D2-C2)) | Format as percent; uses ERI-style denominator |
| Lower-grade overlap % | =IF(OR(B2<=A2,D2<=C2),"Check ranges",MAX(0,MIN(B2,D2)-MAX(A2,C2))/(B2-A2)) | Format as percent; uses lower-grade denominator |
| Positive gap dollars | =MAX(0,C2-B2) | Non-overlapping distance for ascending grades |
Keep the overlap dollars and both percentages in the audit file. Include grade family, location, currency, calculation convention and structure version alongside the numerical result. In a large workbook, one corrupted range minimum can generate a deceptively plausible percentage; a cross-check against the approved salary structure and effective-date records is useful. Use the current salary-band documentation as the live reference.
When moving between a review spreadsheet and governance software, distinguish current employee salaries from the ranges under evaluation. Compensation analytics can help reveal employee distribution and range adherence; compensation reporting provides reviewable grade, midpoint and salary-range outputs. The range calculation should use the policy structure version approved for that decision.
Checklist Before Changing Adjacent Grade Boundaries
- Validate the grade map: confirm job family and grade ownership through job leveling and the underlying evaluated work.
- Validate the market: confirm range midpoints and market-pricing methodology, not only the formula.
- Identify the policy: document whether upper-grade or lower-grade percentage is used and what the organization intends it to mean.
- Model employees: measure who falls below minimum or above maximum if boundaries move, including potential compression risks.
- Check budgets: evaluate proposed salary corrections through compensation planning rather than automatically moving incumbents to a new minimum.
- Approve and version: record the effective date, reviewing owner, rationale and updated salary-range governance before applying changes.
A new structure is not automatically better because a percentage looks tidier. Sometimes the correct action is a manager guideline, clearer job-evaluation boundary or compensation communication, not a redraw of every pay grade. These distinctions matter particularly when organizations manage specialized function-level market positions or different geographic pay policies.
How CompBldr Supports Grade and Salary-Range Governance
CompBldr's Job Architecture gives roles a governed grade and family context; Job Evaluation supports evidence-based grade decisions; Market Benchmarking establishes market targets; and Salary Structure Software connects grade-level pay ranges to employee pay-position review. Its published Compensation Reporting information includes min/mid/max pay-band structures and comparisons of employee salaries with proposed ranges.
Those capabilities create a useful context for examining adjacent-grade overlap, but a buyer should verify whether the current implementation calculates both overlap conventions automatically. The more important demonstration is whether an analyst can follow a proposed grade change from evaluated job value and market data through policy approval, affected employee pay positions, and a reproducible report. Do not infer an automatic overlap optimization feature from a salary-range dashboard alone.
References and Further Reading
- ERI: Common Compensation Terms and Formulas (PDF) : upper-grade salary range overlap denominator.
- Salary.com: Compensation Formulas : an alternative denominator used for range overlap.
- CompBldr: Salary Range Width by Level : range spread and grade-specific salary structure choices.
- CompBldr: Job Grades vs. Job Levels : job architecture context for adjacent-grade decisions.
Review Your Salary Structure With CompBldr
Bring your current grade minimums, midpoints, maximums, and a few real structural questions. Discuss how adjacent grades, market targets and pay-position reporting fit into one governed compensation workflow.
Book a DemoEditorial note: All salary data, pay grades, promotions and numerical examples here are hypothetical. Overlap calculations describe grade ranges, not employee-level equity or legal outcomes. Compensation policy and legal requirements must be assessed for the employer's circumstances.


.svg)

.svg)
.svg)

